Immigrants from Syria vs New Zealander Single Mother Households
COMPARE
Immigrants from Syria
New Zealander
Single Mother Households
Single Mother Households Comparison
Immigrants from Syria
New Zealanders
6.2%
SINGLE MOTHER HOUSEHOLDS
67.4/ 100
METRIC RATING
165th/ 347
METRIC RANK
5.6%
SINGLE MOTHER HOUSEHOLDS
98.2/ 100
METRIC RATING
76th/ 347
METRIC RANK
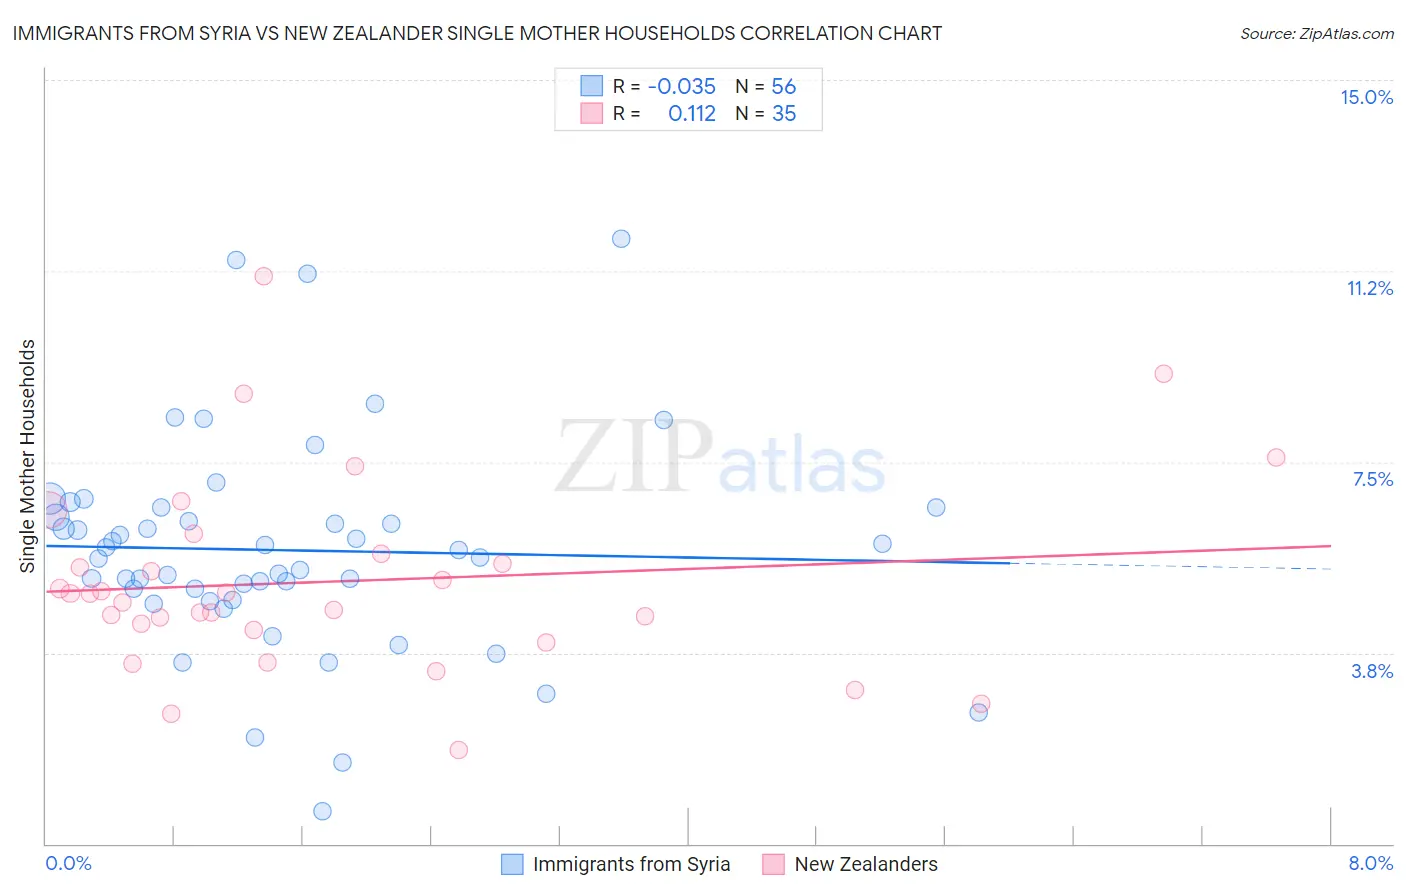
Immigrants from Syria vs New Zealander Single Mother Households Correlation Chart
The statistical analysis conducted on geographies consisting of 174,032,512 people shows no correlation between the proportion of Immigrants from Syria and percentage of single mother households in the United States with a correlation coefficient (R) of -0.035 and weighted average of 6.2%. Similarly, the statistical analysis conducted on geographies consisting of 106,839,899 people shows a poor positive correlation between the proportion of New Zealanders and percentage of single mother households in the United States with a correlation coefficient (R) of 0.112 and weighted average of 5.6%, a difference of 10.1%.
Single Mother Households Correlation Summary
| Measurement | Immigrants from Syria | New Zealander |
| Minimum | 0.64% | 1.8% |
| Maximum | 11.9% | 11.2% |
| Range | 11.2% | 9.3% |
| Mean | 5.8% | 5.2% |
| Median | 5.7% | 4.9% |
| Interquartile 25% (IQ1) | 4.9% | 4.2% |
| Interquartile 75% (IQ3) | 6.5% | 5.7% |
| Interquartile Range (IQR) | 1.6% | 1.5% |
| Standard Deviation (Sample) | 2.1% | 1.9% |
| Standard Deviation (Population) | 2.1% | 1.9% |
Similar Demographics by Single Mother Households
Demographics Similar to Immigrants from Syria by Single Mother Households
In terms of single mother households, the demographic groups most similar to Immigrants from Syria are Immigrants from Northern Africa (6.2%, a difference of 0.070%), Alsatian (6.2%, a difference of 0.16%), Immigrants from Zimbabwe (6.2%, a difference of 0.32%), Sri Lankan (6.2%, a difference of 0.43%), and Immigrants from Germany (6.1%, a difference of 0.67%).
| Demographics | Rating | Rank | Single Mother Households |
| Celtics | 73.3 /100 | #158 | Good 6.1% |
| Yugoslavians | 73.1 /100 | #159 | Good 6.1% |
| Iraqis | 73.0 /100 | #160 | Good 6.1% |
| Immigrants | Germany | 72.4 /100 | #161 | Good 6.1% |
| Immigrants | Zimbabwe | 69.9 /100 | #162 | Good 6.2% |
| Alsatians | 68.7 /100 | #163 | Good 6.2% |
| Immigrants | Northern Africa | 68.0 /100 | #164 | Good 6.2% |
| Immigrants | Syria | 67.4 /100 | #165 | Good 6.2% |
| Sri Lankans | 63.9 /100 | #166 | Good 6.2% |
| Brazilians | 59.1 /100 | #167 | Average 6.2% |
| Immigrants | Chile | 58.3 /100 | #168 | Average 6.3% |
| Puget Sound Salish | 58.1 /100 | #169 | Average 6.3% |
| Immigrants | Oceania | 54.6 /100 | #170 | Average 6.3% |
| Afghans | 52.5 /100 | #171 | Average 6.3% |
| Immigrants | South Eastern Asia | 52.2 /100 | #172 | Average 6.3% |
Demographics Similar to New Zealanders by Single Mother Households
In terms of single mother households, the demographic groups most similar to New Zealanders are Slovene (5.6%, a difference of 0.070%), Romanian (5.6%, a difference of 0.19%), Swiss (5.6%, a difference of 0.19%), Immigrants from North America (5.6%, a difference of 0.21%), and Immigrants from Asia (5.6%, a difference of 0.24%).
| Demographics | Rating | Rank | Single Mother Households |
| Asians | 98.5 /100 | #69 | Exceptional 5.6% |
| Immigrants | Eastern Europe | 98.4 /100 | #70 | Exceptional 5.6% |
| Immigrants | Kazakhstan | 98.4 /100 | #71 | Exceptional 5.6% |
| Immigrants | Netherlands | 98.4 /100 | #72 | Exceptional 5.6% |
| Immigrants | Asia | 98.4 /100 | #73 | Exceptional 5.6% |
| Immigrants | North America | 98.3 /100 | #74 | Exceptional 5.6% |
| Slovenes | 98.3 /100 | #75 | Exceptional 5.6% |
| New Zealanders | 98.2 /100 | #76 | Exceptional 5.6% |
| Romanians | 98.1 /100 | #77 | Exceptional 5.6% |
| Swiss | 98.1 /100 | #78 | Exceptional 5.6% |
| Immigrants | Sri Lanka | 98.0 /100 | #79 | Exceptional 5.6% |
| Czechs | 97.9 /100 | #80 | Exceptional 5.6% |
| Immigrants | Moldova | 97.9 /100 | #81 | Exceptional 5.6% |
| Immigrants | Malaysia | 97.8 /100 | #82 | Exceptional 5.7% |
| Immigrants | Hungary | 97.8 /100 | #83 | Exceptional 5.7% |