Bahamian vs Menominee Births to Unmarried Women
COMPARE
Bahamian
Menominee
Births to Unmarried Women
Births to Unmarried Women Comparison
Bahamians
Menominee
40.8%
BIRTHS TO UNMARRIED WOMEN
0.0/ 100
METRIC RATING
321st/ 347
METRIC RANK
51.1%
BIRTHS TO UNMARRIED WOMEN
0.0/ 100
METRIC RATING
342nd/ 347
METRIC RANK
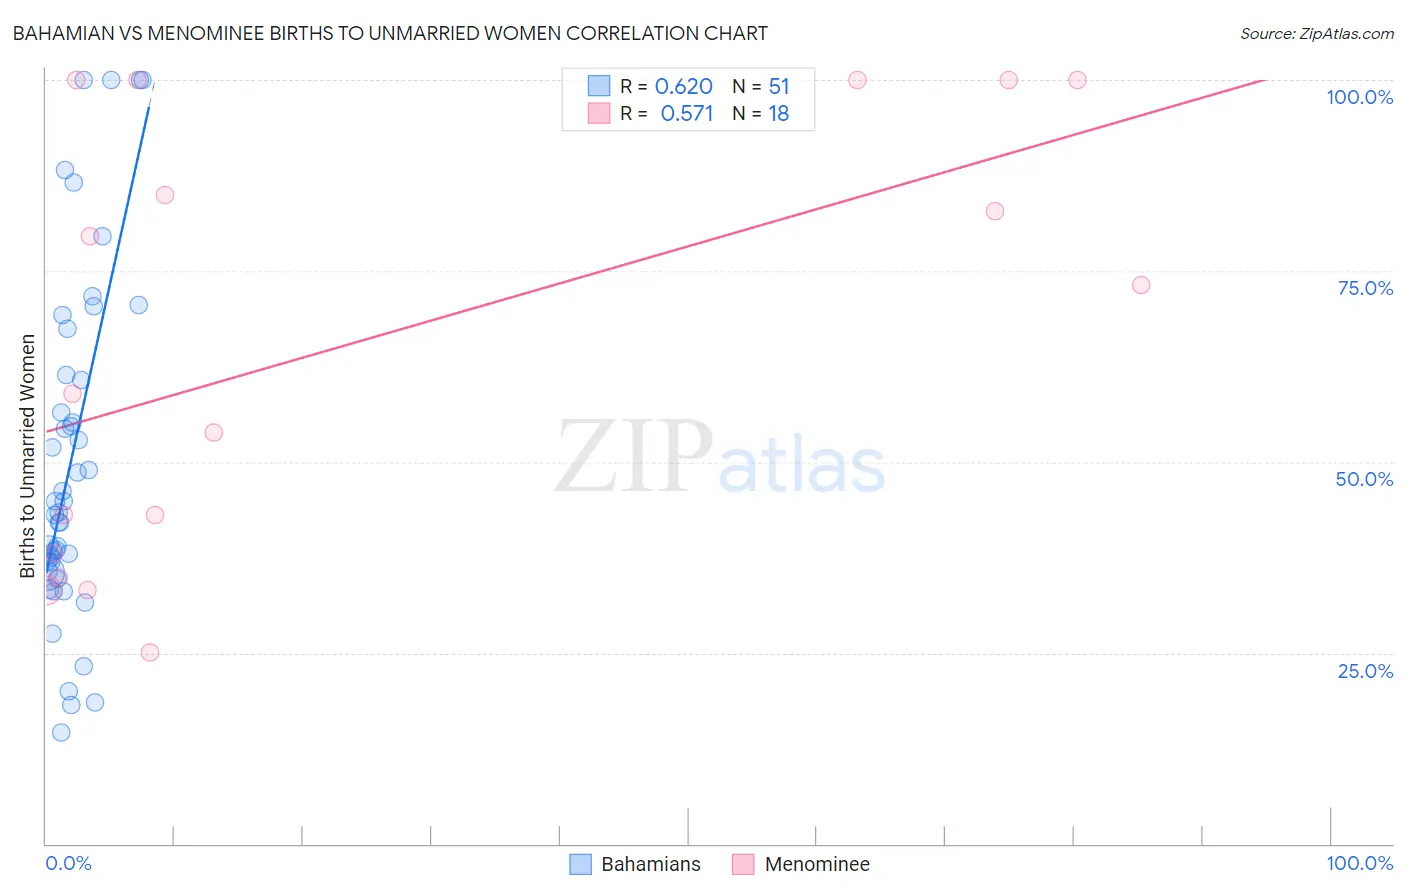
Bahamian vs Menominee Births to Unmarried Women Correlation Chart
The statistical analysis conducted on geographies consisting of 110,519,656 people shows a significant positive correlation between the proportion of Bahamians and percentage of births to unmarried women in the United States with a correlation coefficient (R) of 0.620 and weighted average of 40.8%. Similarly, the statistical analysis conducted on geographies consisting of 44,867,256 people shows a substantial positive correlation between the proportion of Menominee and percentage of births to unmarried women in the United States with a correlation coefficient (R) of 0.571 and weighted average of 51.1%, a difference of 25.4%.
Births to Unmarried Women Correlation Summary
| Measurement | Bahamian | Menominee |
| Minimum | 14.6% | 25.0% |
| Maximum | 100.0% | 100.0% |
| Range | 85.4% | 75.0% |
| Mean | 50.1% | 65.8% |
| Median | 43.3% | 66.0% |
| Interquartile 25% (IQ1) | 35.7% | 38.0% |
| Interquartile 75% (IQ3) | 61.4% | 100.0% |
| Interquartile Range (IQR) | 25.6% | 62.0% |
| Standard Deviation (Sample) | 22.3% | 28.2% |
| Standard Deviation (Population) | 22.1% | 27.4% |
Similar Demographics by Births to Unmarried Women
Demographics Similar to Bahamians by Births to Unmarried Women
In terms of births to unmarried women, the demographic groups most similar to Bahamians are Cajun (41.0%, a difference of 0.49%), Sioux (41.0%, a difference of 0.56%), Crow (40.4%, a difference of 1.0%), Yakama (40.3%, a difference of 1.1%), and Cape Verdean (41.3%, a difference of 1.4%).
| Demographics | Rating | Rank | Births to Unmarried Women |
| Immigrants | Caribbean | 0.0 /100 | #314 | Tragic 39.8% |
| Dominicans | 0.0 /100 | #315 | Tragic 39.8% |
| Apache | 0.0 /100 | #316 | Tragic 39.9% |
| Immigrants | Dominican Republic | 0.0 /100 | #317 | Tragic 40.1% |
| Immigrants | Bahamas | 0.0 /100 | #318 | Tragic 40.1% |
| Yakama | 0.0 /100 | #319 | Tragic 40.3% |
| Crow | 0.0 /100 | #320 | Tragic 40.4% |
| Bahamians | 0.0 /100 | #321 | Tragic 40.8% |
| Cajuns | 0.0 /100 | #322 | Tragic 41.0% |
| Sioux | 0.0 /100 | #323 | Tragic 41.0% |
| Cape Verdeans | 0.0 /100 | #324 | Tragic 41.3% |
| Cheyenne | 0.0 /100 | #325 | Tragic 41.3% |
| Immigrants | Cuba | 0.0 /100 | #326 | Tragic 41.5% |
| Tsimshian | 0.0 /100 | #327 | Tragic 42.2% |
| Immigrants | Cabo Verde | 0.0 /100 | #328 | Tragic 42.2% |
Demographics Similar to Menominee by Births to Unmarried Women
In terms of births to unmarried women, the demographic groups most similar to Menominee are Hopi (50.8%, a difference of 0.59%), Pima (51.5%, a difference of 0.70%), Navajo (51.5%, a difference of 0.74%), Inupiat (52.1%, a difference of 1.9%), and Tohono O'odham (49.8%, a difference of 2.5%).
| Demographics | Rating | Rank | Births to Unmarried Women |
| Blacks/African Americans | 0.0 /100 | #333 | Tragic 44.3% |
| Yuman | 0.0 /100 | #334 | Tragic 44.4% |
| Colville | 0.0 /100 | #335 | Tragic 45.3% |
| Puerto Ricans | 0.0 /100 | #336 | Tragic 45.7% |
| Houma | 0.0 /100 | #337 | Tragic 46.6% |
| Arapaho | 0.0 /100 | #338 | Tragic 47.1% |
| Lumbee | 0.0 /100 | #339 | Tragic 48.2% |
| Tohono O'odham | 0.0 /100 | #340 | Tragic 49.8% |
| Hopi | 0.0 /100 | #341 | Tragic 50.8% |
| Menominee | 0.0 /100 | #342 | Tragic 51.1% |
| Pima | 0.0 /100 | #343 | Tragic 51.5% |
| Navajo | 0.0 /100 | #344 | Tragic 51.5% |
| Inupiat | 0.0 /100 | #345 | Tragic 52.1% |
| Pueblo | 0.0 /100 | #346 | Tragic 53.7% |
| Yup'ik | 0.0 /100 | #347 | Tragic 56.4% |