Bahamian vs Immigrants from South Eastern Asia Births to Unmarried Women
COMPARE
Bahamian
Immigrants from South Eastern Asia
Births to Unmarried Women
Births to Unmarried Women Comparison
Bahamians
Immigrants from South Eastern Asia
40.8%
BIRTHS TO UNMARRIED WOMEN
0.0/ 100
METRIC RATING
321st/ 347
METRIC RANK
30.4%
BIRTHS TO UNMARRIED WOMEN
85.2/ 100
METRIC RATING
134th/ 347
METRIC RANK
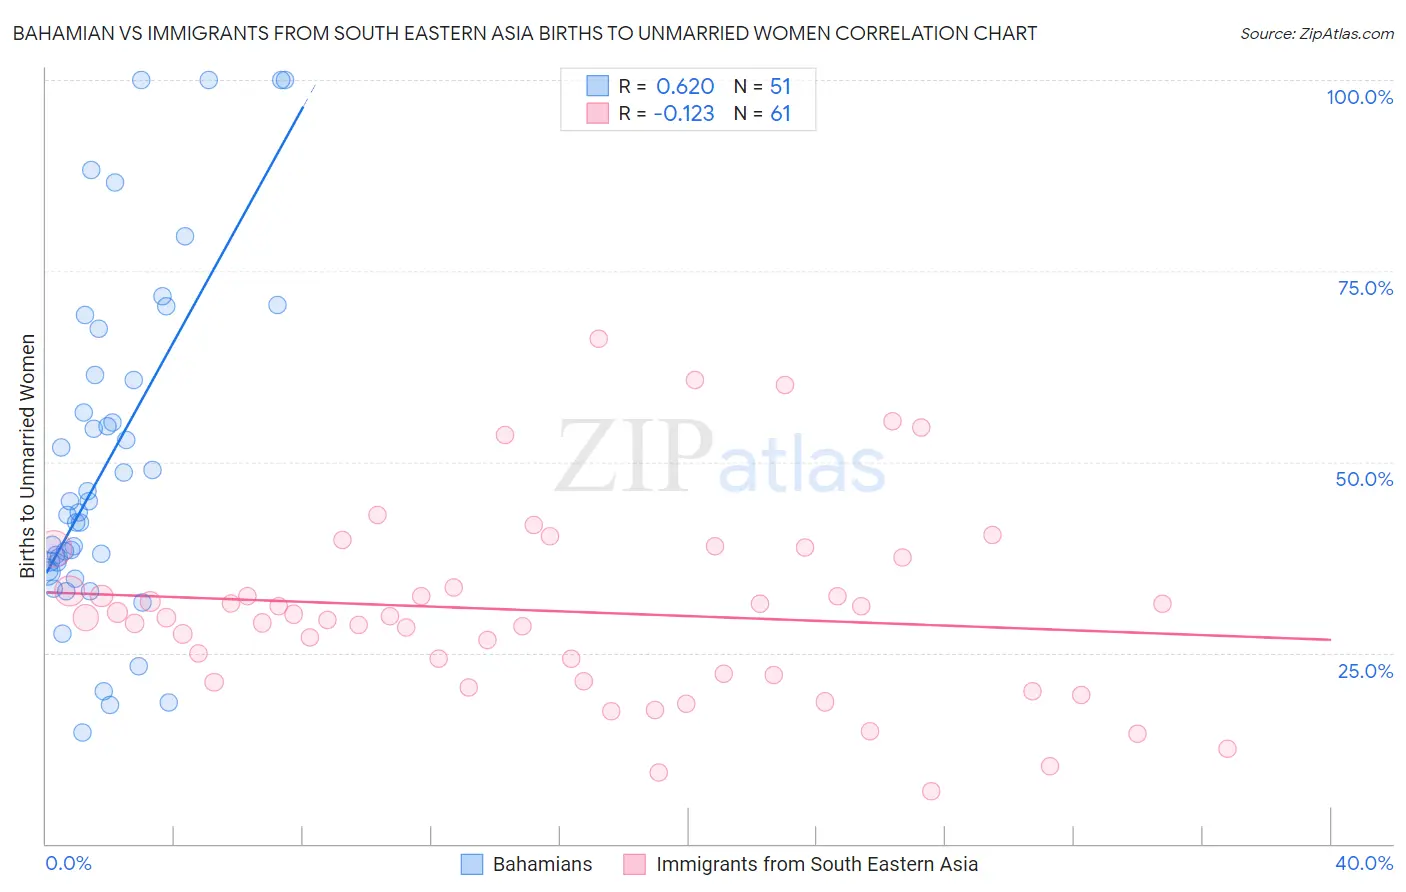
Bahamian vs Immigrants from South Eastern Asia Births to Unmarried Women Correlation Chart
The statistical analysis conducted on geographies consisting of 110,519,656 people shows a significant positive correlation between the proportion of Bahamians and percentage of births to unmarried women in the United States with a correlation coefficient (R) of 0.620 and weighted average of 40.8%. Similarly, the statistical analysis conducted on geographies consisting of 468,318,705 people shows a poor negative correlation between the proportion of Immigrants from South Eastern Asia and percentage of births to unmarried women in the United States with a correlation coefficient (R) of -0.123 and weighted average of 30.4%, a difference of 34.3%.
Births to Unmarried Women Correlation Summary
| Measurement | Bahamian | Immigrants from South Eastern Asia |
| Minimum | 14.6% | 6.9% |
| Maximum | 100.0% | 66.2% |
| Range | 85.4% | 59.3% |
| Mean | 50.1% | 30.4% |
| Median | 43.3% | 29.7% |
| Interquartile 25% (IQ1) | 35.7% | 21.7% |
| Interquartile 75% (IQ3) | 61.4% | 35.4% |
| Interquartile Range (IQR) | 25.6% | 13.7% |
| Standard Deviation (Sample) | 22.3% | 12.5% |
| Standard Deviation (Population) | 22.1% | 12.4% |
Similar Demographics by Births to Unmarried Women
Demographics Similar to Bahamians by Births to Unmarried Women
In terms of births to unmarried women, the demographic groups most similar to Bahamians are Cajun (41.0%, a difference of 0.49%), Sioux (41.0%, a difference of 0.56%), Crow (40.4%, a difference of 1.0%), Yakama (40.3%, a difference of 1.1%), and Cape Verdean (41.3%, a difference of 1.4%).
| Demographics | Rating | Rank | Births to Unmarried Women |
| Immigrants | Caribbean | 0.0 /100 | #314 | Tragic 39.8% |
| Dominicans | 0.0 /100 | #315 | Tragic 39.8% |
| Apache | 0.0 /100 | #316 | Tragic 39.9% |
| Immigrants | Dominican Republic | 0.0 /100 | #317 | Tragic 40.1% |
| Immigrants | Bahamas | 0.0 /100 | #318 | Tragic 40.1% |
| Yakama | 0.0 /100 | #319 | Tragic 40.3% |
| Crow | 0.0 /100 | #320 | Tragic 40.4% |
| Bahamians | 0.0 /100 | #321 | Tragic 40.8% |
| Cajuns | 0.0 /100 | #322 | Tragic 41.0% |
| Sioux | 0.0 /100 | #323 | Tragic 41.0% |
| Cape Verdeans | 0.0 /100 | #324 | Tragic 41.3% |
| Cheyenne | 0.0 /100 | #325 | Tragic 41.3% |
| Immigrants | Cuba | 0.0 /100 | #326 | Tragic 41.5% |
| Tsimshian | 0.0 /100 | #327 | Tragic 42.2% |
| Immigrants | Cabo Verde | 0.0 /100 | #328 | Tragic 42.2% |
Demographics Similar to Immigrants from South Eastern Asia by Births to Unmarried Women
In terms of births to unmarried women, the demographic groups most similar to Immigrants from South Eastern Asia are Immigrants from Morocco (30.4%, a difference of 0.010%), New Zealander (30.3%, a difference of 0.060%), Brazilian (30.4%, a difference of 0.070%), Immigrants from Zimbabwe (30.3%, a difference of 0.090%), and Immigrants from Bosnia and Herzegovina (30.3%, a difference of 0.10%).
| Demographics | Rating | Rank | Births to Unmarried Women |
| Chinese | 87.1 /100 | #127 | Excellent 30.2% |
| Icelanders | 86.0 /100 | #128 | Excellent 30.3% |
| Immigrants | Spain | 85.8 /100 | #129 | Excellent 30.3% |
| Immigrants | Bosnia and Herzegovina | 85.7 /100 | #130 | Excellent 30.3% |
| Immigrants | Zimbabwe | 85.7 /100 | #131 | Excellent 30.3% |
| New Zealanders | 85.5 /100 | #132 | Excellent 30.3% |
| Immigrants | Morocco | 85.2 /100 | #133 | Excellent 30.4% |
| Immigrants | South Eastern Asia | 85.2 /100 | #134 | Excellent 30.4% |
| Brazilians | 84.8 /100 | #135 | Excellent 30.4% |
| Immigrants | Scotland | 84.6 /100 | #136 | Excellent 30.4% |
| Immigrants | Philippines | 83.9 /100 | #137 | Excellent 30.4% |
| Puget Sound Salish | 83.9 /100 | #138 | Excellent 30.4% |
| Immigrants | Canada | 83.7 /100 | #139 | Excellent 30.4% |
| Swiss | 83.1 /100 | #140 | Excellent 30.5% |
| Pakistanis | 83.0 /100 | #141 | Excellent 30.5% |