Immigrants from North Macedonia vs Menominee Births to Unmarried Women
COMPARE
Immigrants from North Macedonia
Menominee
Births to Unmarried Women
Births to Unmarried Women Comparison
Immigrants from North Macedonia
Menominee
28.1%
BIRTHS TO UNMARRIED WOMEN
99.1/ 100
METRIC RATING
61st/ 347
METRIC RANK
51.1%
BIRTHS TO UNMARRIED WOMEN
0.0/ 100
METRIC RATING
342nd/ 347
METRIC RANK
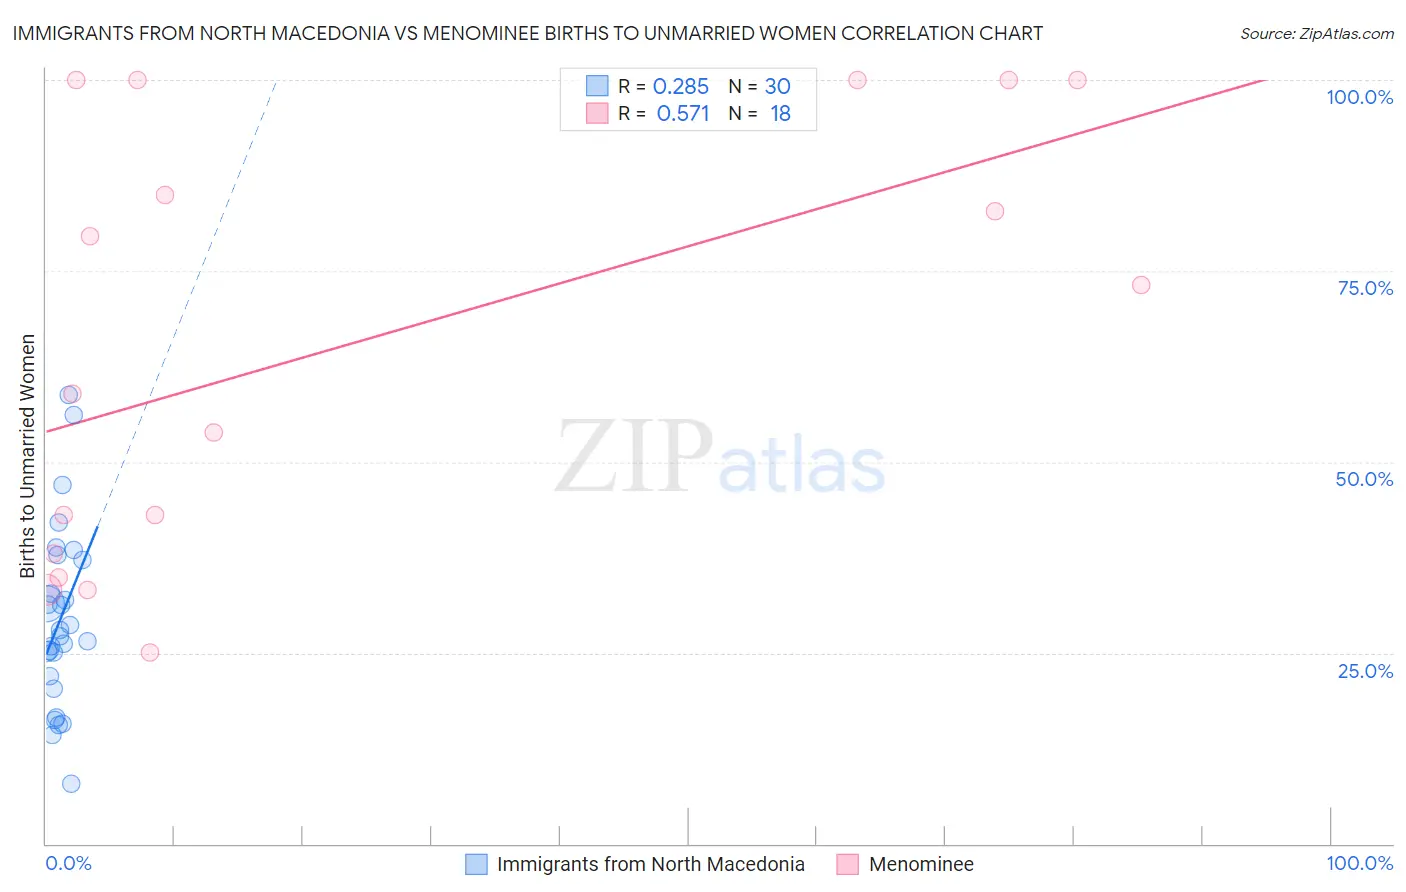
Immigrants from North Macedonia vs Menominee Births to Unmarried Women Correlation Chart
The statistical analysis conducted on geographies consisting of 71,828,826 people shows a weak positive correlation between the proportion of Immigrants from North Macedonia and percentage of births to unmarried women in the United States with a correlation coefficient (R) of 0.285 and weighted average of 28.1%. Similarly, the statistical analysis conducted on geographies consisting of 44,867,256 people shows a substantial positive correlation between the proportion of Menominee and percentage of births to unmarried women in the United States with a correlation coefficient (R) of 0.571 and weighted average of 51.1%, a difference of 81.6%.
Births to Unmarried Women Correlation Summary
| Measurement | Immigrants from North Macedonia | Menominee |
| Minimum | 7.8% | 25.0% |
| Maximum | 58.8% | 100.0% |
| Range | 51.0% | 75.0% |
| Mean | 29.4% | 65.8% |
| Median | 27.6% | 66.0% |
| Interquartile 25% (IQ1) | 22.0% | 38.0% |
| Interquartile 75% (IQ3) | 37.2% | 100.0% |
| Interquartile Range (IQR) | 15.2% | 62.0% |
| Standard Deviation (Sample) | 11.8% | 28.2% |
| Standard Deviation (Population) | 11.6% | 27.4% |
Similar Demographics by Births to Unmarried Women
Demographics Similar to Immigrants from North Macedonia by Births to Unmarried Women
In terms of births to unmarried women, the demographic groups most similar to Immigrants from North Macedonia are Immigrants from Turkey (28.1%, a difference of 0.040%), Immigrants from Kazakhstan (28.1%, a difference of 0.090%), Egyptian (28.2%, a difference of 0.32%), Immigrants from Albania (28.0%, a difference of 0.34%), and Russian (28.0%, a difference of 0.45%).
| Demographics | Rating | Rank | Births to Unmarried Women |
| Afghans | 99.4 /100 | #54 | Exceptional 27.9% |
| Mongolians | 99.3 /100 | #55 | Exceptional 27.9% |
| Immigrants | Belgium | 99.3 /100 | #56 | Exceptional 28.0% |
| Russians | 99.2 /100 | #57 | Exceptional 28.0% |
| Immigrants | Albania | 99.2 /100 | #58 | Exceptional 28.0% |
| Immigrants | Kazakhstan | 99.1 /100 | #59 | Exceptional 28.1% |
| Immigrants | Turkey | 99.1 /100 | #60 | Exceptional 28.1% |
| Immigrants | North Macedonia | 99.1 /100 | #61 | Exceptional 28.1% |
| Egyptians | 99.0 /100 | #62 | Exceptional 28.2% |
| Immigrants | Serbia | 98.9 /100 | #63 | Exceptional 28.3% |
| Tongans | 98.8 /100 | #64 | Exceptional 28.4% |
| Immigrants | Czechoslovakia | 98.8 /100 | #65 | Exceptional 28.4% |
| Immigrants | Egypt | 98.8 /100 | #66 | Exceptional 28.4% |
| Palestinians | 98.7 /100 | #67 | Exceptional 28.4% |
| Immigrants | Europe | 98.7 /100 | #68 | Exceptional 28.4% |
Demographics Similar to Menominee by Births to Unmarried Women
In terms of births to unmarried women, the demographic groups most similar to Menominee are Hopi (50.8%, a difference of 0.59%), Pima (51.5%, a difference of 0.70%), Navajo (51.5%, a difference of 0.74%), Inupiat (52.1%, a difference of 1.9%), and Tohono O'odham (49.8%, a difference of 2.5%).
| Demographics | Rating | Rank | Births to Unmarried Women |
| Blacks/African Americans | 0.0 /100 | #333 | Tragic 44.3% |
| Yuman | 0.0 /100 | #334 | Tragic 44.4% |
| Colville | 0.0 /100 | #335 | Tragic 45.3% |
| Puerto Ricans | 0.0 /100 | #336 | Tragic 45.7% |
| Houma | 0.0 /100 | #337 | Tragic 46.6% |
| Arapaho | 0.0 /100 | #338 | Tragic 47.1% |
| Lumbee | 0.0 /100 | #339 | Tragic 48.2% |
| Tohono O'odham | 0.0 /100 | #340 | Tragic 49.8% |
| Hopi | 0.0 /100 | #341 | Tragic 50.8% |
| Menominee | 0.0 /100 | #342 | Tragic 51.1% |
| Pima | 0.0 /100 | #343 | Tragic 51.5% |
| Navajo | 0.0 /100 | #344 | Tragic 51.5% |
| Inupiat | 0.0 /100 | #345 | Tragic 52.1% |
| Pueblo | 0.0 /100 | #346 | Tragic 53.7% |
| Yup'ik | 0.0 /100 | #347 | Tragic 56.4% |