Bahamian vs Immigrants from Trinidad and Tobago Births to Unmarried Women
COMPARE
Bahamian
Immigrants from Trinidad and Tobago
Births to Unmarried Women
Births to Unmarried Women Comparison
Bahamians
Immigrants from Trinidad and Tobago
40.8%
BIRTHS TO UNMARRIED WOMEN
0.0/ 100
METRIC RATING
321st/ 347
METRIC RANK
36.3%
BIRTHS TO UNMARRIED WOMEN
0.2/ 100
METRIC RATING
256th/ 347
METRIC RANK
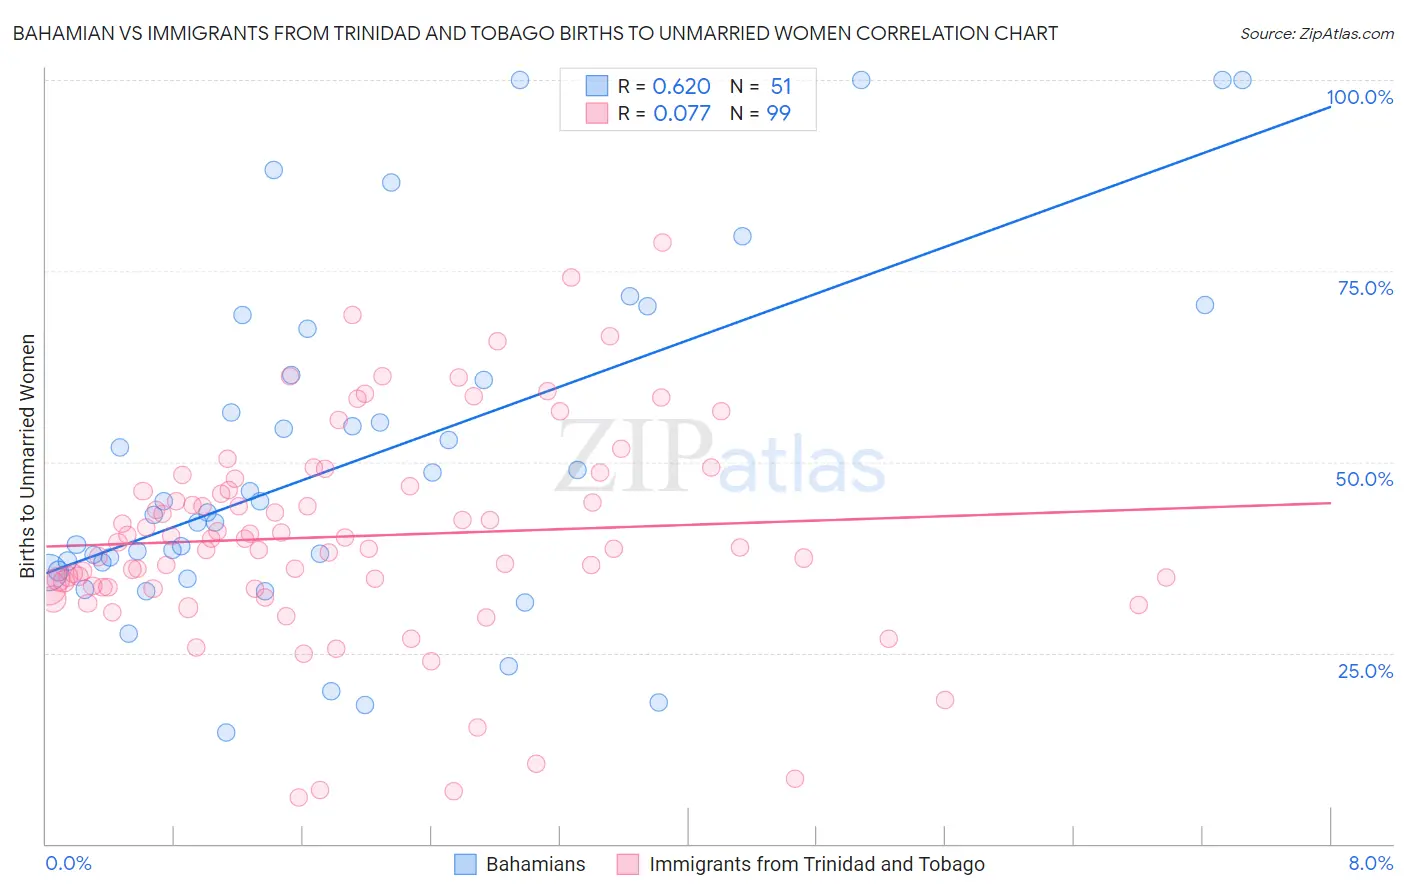
Bahamian vs Immigrants from Trinidad and Tobago Births to Unmarried Women Correlation Chart
The statistical analysis conducted on geographies consisting of 110,519,656 people shows a significant positive correlation between the proportion of Bahamians and percentage of births to unmarried women in the United States with a correlation coefficient (R) of 0.620 and weighted average of 40.8%. Similarly, the statistical analysis conducted on geographies consisting of 215,338,343 people shows a slight positive correlation between the proportion of Immigrants from Trinidad and Tobago and percentage of births to unmarried women in the United States with a correlation coefficient (R) of 0.077 and weighted average of 36.3%, a difference of 12.3%.
Births to Unmarried Women Correlation Summary
| Measurement | Bahamian | Immigrants from Trinidad and Tobago |
| Minimum | 14.6% | 6.1% |
| Maximum | 100.0% | 78.7% |
| Range | 85.4% | 72.6% |
| Mean | 50.1% | 40.3% |
| Median | 43.3% | 39.5% |
| Interquartile 25% (IQ1) | 35.7% | 33.6% |
| Interquartile 75% (IQ3) | 61.4% | 46.8% |
| Interquartile Range (IQR) | 25.6% | 13.2% |
| Standard Deviation (Sample) | 22.3% | 13.7% |
| Standard Deviation (Population) | 22.1% | 13.7% |
Similar Demographics by Births to Unmarried Women
Demographics Similar to Bahamians by Births to Unmarried Women
In terms of births to unmarried women, the demographic groups most similar to Bahamians are Cajun (41.0%, a difference of 0.49%), Sioux (41.0%, a difference of 0.56%), Crow (40.4%, a difference of 1.0%), Yakama (40.3%, a difference of 1.1%), and Cape Verdean (41.3%, a difference of 1.4%).
| Demographics | Rating | Rank | Births to Unmarried Women |
| Immigrants | Caribbean | 0.0 /100 | #314 | Tragic 39.8% |
| Dominicans | 0.0 /100 | #315 | Tragic 39.8% |
| Apache | 0.0 /100 | #316 | Tragic 39.9% |
| Immigrants | Dominican Republic | 0.0 /100 | #317 | Tragic 40.1% |
| Immigrants | Bahamas | 0.0 /100 | #318 | Tragic 40.1% |
| Yakama | 0.0 /100 | #319 | Tragic 40.3% |
| Crow | 0.0 /100 | #320 | Tragic 40.4% |
| Bahamians | 0.0 /100 | #321 | Tragic 40.8% |
| Cajuns | 0.0 /100 | #322 | Tragic 41.0% |
| Sioux | 0.0 /100 | #323 | Tragic 41.0% |
| Cape Verdeans | 0.0 /100 | #324 | Tragic 41.3% |
| Cheyenne | 0.0 /100 | #325 | Tragic 41.3% |
| Immigrants | Cuba | 0.0 /100 | #326 | Tragic 41.5% |
| Tsimshian | 0.0 /100 | #327 | Tragic 42.2% |
| Immigrants | Cabo Verde | 0.0 /100 | #328 | Tragic 42.2% |
Demographics Similar to Immigrants from Trinidad and Tobago by Births to Unmarried Women
In terms of births to unmarried women, the demographic groups most similar to Immigrants from Trinidad and Tobago are Chickasaw (36.3%, a difference of 0.0%), Immigrants from Grenada (36.3%, a difference of 0.030%), Potawatomi (36.2%, a difference of 0.14%), American (36.4%, a difference of 0.31%), and Immigrants from Portugal (36.2%, a difference of 0.36%).
| Demographics | Rating | Rank | Births to Unmarried Women |
| Bermudans | 0.6 /100 | #249 | Tragic 35.5% |
| Mexican American Indians | 0.4 /100 | #250 | Tragic 35.7% |
| Immigrants | Western Africa | 0.3 /100 | #251 | Tragic 36.0% |
| Salvadorans | 0.3 /100 | #252 | Tragic 36.0% |
| Immigrants | Portugal | 0.2 /100 | #253 | Tragic 36.2% |
| Potawatomi | 0.2 /100 | #254 | Tragic 36.2% |
| Chickasaw | 0.2 /100 | #255 | Tragic 36.3% |
| Immigrants | Trinidad and Tobago | 0.2 /100 | #256 | Tragic 36.3% |
| Immigrants | Grenada | 0.2 /100 | #257 | Tragic 36.3% |
| Americans | 0.2 /100 | #258 | Tragic 36.4% |
| Immigrants | El Salvador | 0.2 /100 | #259 | Tragic 36.4% |
| Ottawa | 0.2 /100 | #260 | Tragic 36.5% |
| Trinidadians and Tobagonians | 0.2 /100 | #261 | Tragic 36.5% |
| French American Indians | 0.1 /100 | #262 | Tragic 36.6% |
| Nicaraguans | 0.1 /100 | #263 | Tragic 36.6% |