Australian vs Immigrants from Albania Median Family Income
COMPARE
Australian
Immigrants from Albania
Median Family Income
Median Family Income Comparison
Australians
Immigrants from Albania
$118,440
MEDIAN FAMILY INCOME
100.0/ 100
METRIC RATING
37th/ 347
METRIC RANK
$105,285
MEDIAN FAMILY INCOME
79.1/ 100
METRIC RATING
152nd/ 347
METRIC RANK
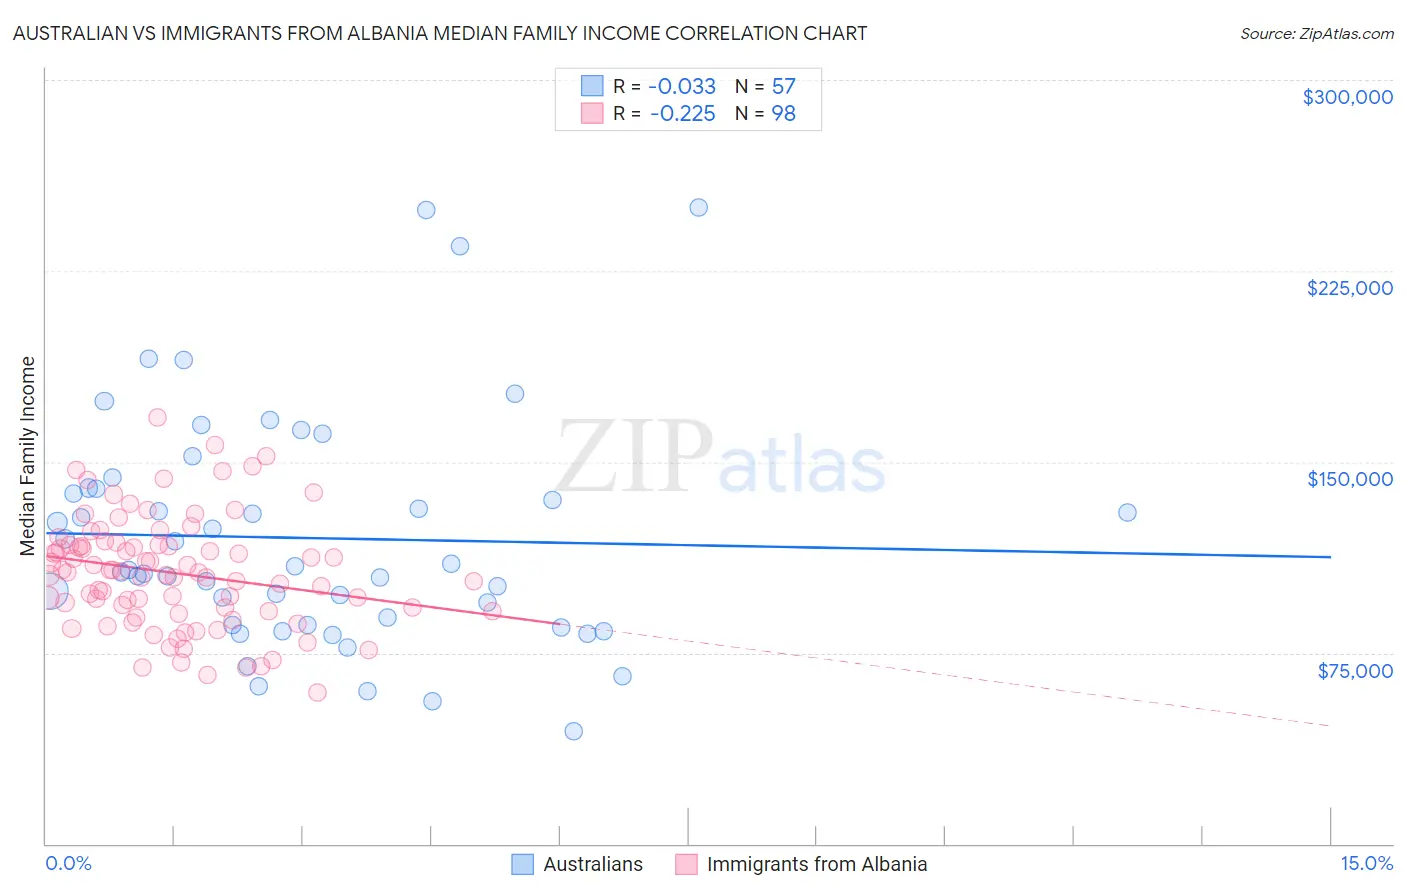
Australian vs Immigrants from Albania Median Family Income Correlation Chart
The statistical analysis conducted on geographies consisting of 223,969,343 people shows no correlation between the proportion of Australians and median family income in the United States with a correlation coefficient (R) of -0.033 and weighted average of $118,440. Similarly, the statistical analysis conducted on geographies consisting of 119,337,318 people shows a weak negative correlation between the proportion of Immigrants from Albania and median family income in the United States with a correlation coefficient (R) of -0.225 and weighted average of $105,285, a difference of 12.5%.
Median Family Income Correlation Summary
| Measurement | Australian | Immigrants from Albania |
| Minimum | $44,219 | $59,250 |
| Maximum | $250,001 | $167,526 |
| Range | $205,782 | $108,276 |
| Mean | $120,063 | $106,367 |
| Median | $107,342 | $106,522 |
| Interquartile 25% (IQ1) | $85,865 | $91,250 |
| Interquartile 75% (IQ3) | $139,651 | $117,507 |
| Interquartile Range (IQR) | $53,786 | $26,257 |
| Standard Deviation (Sample) | $45,096 | $21,718 |
| Standard Deviation (Population) | $44,699 | $21,607 |
Similar Demographics by Median Family Income
Demographics Similar to Australians by Median Family Income
In terms of median family income, the demographic groups most similar to Australians are Immigrants from Turkey ($118,325, a difference of 0.10%), Israeli ($118,577, a difference of 0.12%), Immigrants from Asia ($118,291, a difference of 0.13%), Immigrants from Lithuania ($118,053, a difference of 0.33%), and Estonian ($118,013, a difference of 0.36%).
| Demographics | Rating | Rank | Median Family Income |
| Immigrants | Sri Lanka | 100.0 /100 | #30 | Exceptional $120,263 |
| Immigrants | France | 100.0 /100 | #31 | Exceptional $120,076 |
| Asians | 100.0 /100 | #32 | Exceptional $119,955 |
| Bhutanese | 100.0 /100 | #33 | Exceptional $119,800 |
| Bolivians | 100.0 /100 | #34 | Exceptional $119,479 |
| Soviet Union | 100.0 /100 | #35 | Exceptional $119,262 |
| Israelis | 100.0 /100 | #36 | Exceptional $118,577 |
| Australians | 100.0 /100 | #37 | Exceptional $118,440 |
| Immigrants | Turkey | 100.0 /100 | #38 | Exceptional $118,325 |
| Immigrants | Asia | 100.0 /100 | #39 | Exceptional $118,291 |
| Immigrants | Lithuania | 100.0 /100 | #40 | Exceptional $118,053 |
| Estonians | 100.0 /100 | #41 | Exceptional $118,013 |
| Immigrants | Bolivia | 100.0 /100 | #42 | Exceptional $117,912 |
| Bulgarians | 100.0 /100 | #43 | Exceptional $117,818 |
| Cambodians | 100.0 /100 | #44 | Exceptional $117,780 |
Demographics Similar to Immigrants from Albania by Median Family Income
In terms of median family income, the demographic groups most similar to Immigrants from Albania are Slavic ($105,144, a difference of 0.13%), Peruvian ($105,444, a difference of 0.15%), Irish ($105,453, a difference of 0.16%), Immigrants from Germany ($105,507, a difference of 0.21%), and Immigrants from Nepal ($104,966, a difference of 0.30%).
| Demographics | Rating | Rank | Median Family Income |
| Danes | 83.8 /100 | #145 | Excellent $105,900 |
| Czechs | 83.4 /100 | #146 | Excellent $105,839 |
| Immigrants | Chile | 82.1 /100 | #147 | Excellent $105,655 |
| Hungarians | 81.7 /100 | #148 | Excellent $105,609 |
| Immigrants | Germany | 80.9 /100 | #149 | Excellent $105,507 |
| Irish | 80.5 /100 | #150 | Excellent $105,453 |
| Peruvians | 80.4 /100 | #151 | Excellent $105,444 |
| Immigrants | Albania | 79.1 /100 | #152 | Good $105,285 |
| Slavs | 77.9 /100 | #153 | Good $105,144 |
| Immigrants | Nepal | 76.3 /100 | #154 | Good $104,966 |
| Native Hawaiians | 75.8 /100 | #155 | Good $104,910 |
| Basques | 74.4 /100 | #156 | Good $104,760 |
| Moroccans | 71.6 /100 | #157 | Good $104,488 |
| Scandinavians | 70.8 /100 | #158 | Good $104,410 |
| Swiss | 70.7 /100 | #159 | Good $104,396 |