Seminole vs Immigrants from Lebanon Divorced or Separated
COMPARE
Seminole
Immigrants from Lebanon
Divorced or Separated
Divorced or Separated Comparison
Seminole
Immigrants from Lebanon
14.3%
DIVORCED OR SEPARATED
0.0/ 100
METRIC RATING
342nd/ 347
METRIC RANK
11.1%
DIVORCED OR SEPARATED
100.0/ 100
METRIC RATING
37th/ 347
METRIC RANK
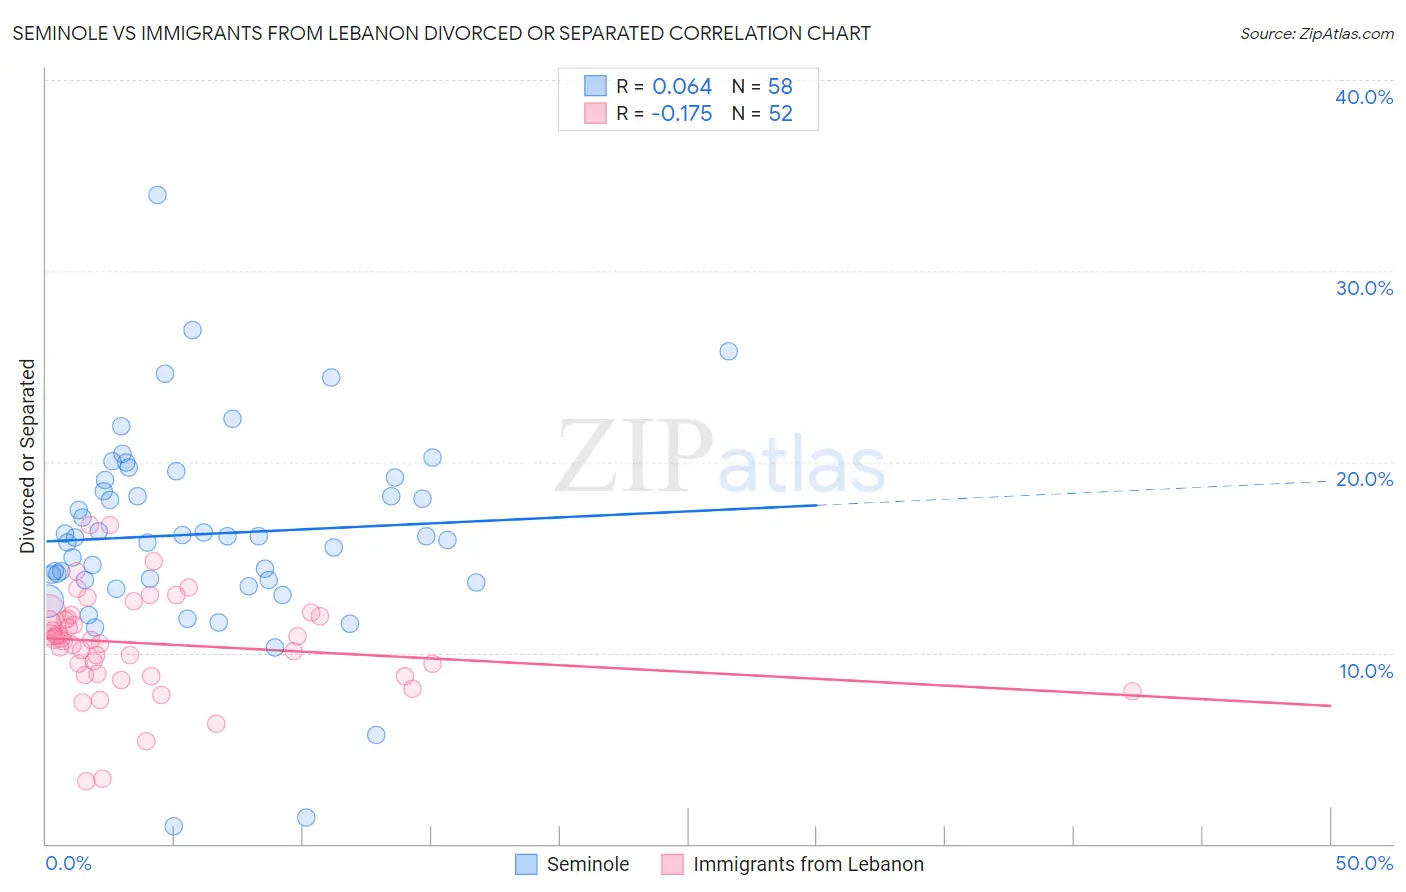
Seminole vs Immigrants from Lebanon Divorced or Separated Correlation Chart
The statistical analysis conducted on geographies consisting of 118,302,792 people shows a slight positive correlation between the proportion of Seminole and percentage of population currently divorced or separated in the United States with a correlation coefficient (R) of 0.064 and weighted average of 14.3%. Similarly, the statistical analysis conducted on geographies consisting of 217,122,849 people shows a poor negative correlation between the proportion of Immigrants from Lebanon and percentage of population currently divorced or separated in the United States with a correlation coefficient (R) of -0.175 and weighted average of 11.1%, a difference of 28.4%.
Divorced or Separated Correlation Summary
| Measurement | Seminole | Immigrants from Lebanon |
| Minimum | 0.90% | 3.3% |
| Maximum | 34.0% | 16.7% |
| Range | 33.1% | 13.4% |
| Mean | 16.2% | 10.5% |
| Median | 16.1% | 10.7% |
| Interquartile 25% (IQ1) | 13.8% | 8.9% |
| Interquartile 75% (IQ3) | 19.0% | 11.9% |
| Interquartile Range (IQR) | 5.2% | 3.1% |
| Standard Deviation (Sample) | 5.4% | 2.7% |
| Standard Deviation (Population) | 5.3% | 2.7% |
Similar Demographics by Divorced or Separated
Demographics Similar to Seminole by Divorced or Separated
In terms of divorced or separated, the demographic groups most similar to Seminole are Bahamian (14.2%, a difference of 0.17%), Chickasaw (14.2%, a difference of 0.36%), Colville (14.2%, a difference of 0.40%), Choctaw (14.1%, a difference of 0.93%), and Creek (14.4%, a difference of 1.1%).
| Demographics | Rating | Rank | Divorced or Separated |
| Puerto Ricans | 0.0 /100 | #333 | Tragic 13.9% |
| Immigrants | Bahamas | 0.0 /100 | #334 | Tragic 13.9% |
| Dutch West Indians | 0.0 /100 | #335 | Tragic 14.0% |
| Shoshone | 0.0 /100 | #336 | Tragic 14.0% |
| Crow | 0.0 /100 | #337 | Tragic 14.1% |
| Choctaw | 0.0 /100 | #338 | Tragic 14.1% |
| Colville | 0.0 /100 | #339 | Tragic 14.2% |
| Chickasaw | 0.0 /100 | #340 | Tragic 14.2% |
| Bahamians | 0.0 /100 | #341 | Tragic 14.2% |
| Seminole | 0.0 /100 | #342 | Tragic 14.3% |
| Creek | 0.0 /100 | #343 | Tragic 14.4% |
| Cubans | 0.0 /100 | #344 | Tragic 14.5% |
| Kiowa | 0.0 /100 | #345 | Tragic 14.5% |
| Arapaho | 0.0 /100 | #346 | Tragic 14.8% |
| Immigrants | Cuba | 0.0 /100 | #347 | Tragic 15.2% |
Demographics Similar to Immigrants from Lebanon by Divorced or Separated
In terms of divorced or separated, the demographic groups most similar to Immigrants from Lebanon are Immigrants from Japan (11.1%, a difference of 0.010%), Immigrants from Greece (11.1%, a difference of 0.060%), Cambodian (11.1%, a difference of 0.070%), Immigrants from Uzbekistan (11.1%, a difference of 0.15%), and Egyptian (11.1%, a difference of 0.22%).
| Demographics | Rating | Rank | Divorced or Separated |
| Immigrants | Ireland | 100.0 /100 | #30 | Exceptional 11.0% |
| Mongolians | 100.0 /100 | #31 | Exceptional 11.1% |
| Tongans | 100.0 /100 | #32 | Exceptional 11.1% |
| Egyptians | 100.0 /100 | #33 | Exceptional 11.1% |
| Immigrants | Uzbekistan | 100.0 /100 | #34 | Exceptional 11.1% |
| Cambodians | 100.0 /100 | #35 | Exceptional 11.1% |
| Immigrants | Japan | 100.0 /100 | #36 | Exceptional 11.1% |
| Immigrants | Lebanon | 100.0 /100 | #37 | Exceptional 11.1% |
| Immigrants | Greece | 100.0 /100 | #38 | Exceptional 11.1% |
| Immigrants | Egypt | 100.0 /100 | #39 | Exceptional 11.1% |
| Soviet Union | 100.0 /100 | #40 | Exceptional 11.1% |
| Bhutanese | 100.0 /100 | #41 | Exceptional 11.2% |
| Chinese | 100.0 /100 | #42 | Exceptional 11.2% |
| Immigrants | Belarus | 100.0 /100 | #43 | Exceptional 11.2% |
| Immigrants | Western Asia | 100.0 /100 | #44 | Exceptional 11.2% |