Arapaho vs Immigrants from Kuwait Average Family Size
COMPARE
Arapaho
Immigrants from Kuwait
Average Family Size
Average Family Size Comparison
Arapaho
Immigrants from Kuwait
3.64
AVERAGE FAMILY SIZE
100.0/ 100
METRIC RATING
6th/ 347
METRIC RANK
3.19
AVERAGE FAMILY SIZE
7.2/ 100
METRIC RATING
222nd/ 347
METRIC RANK
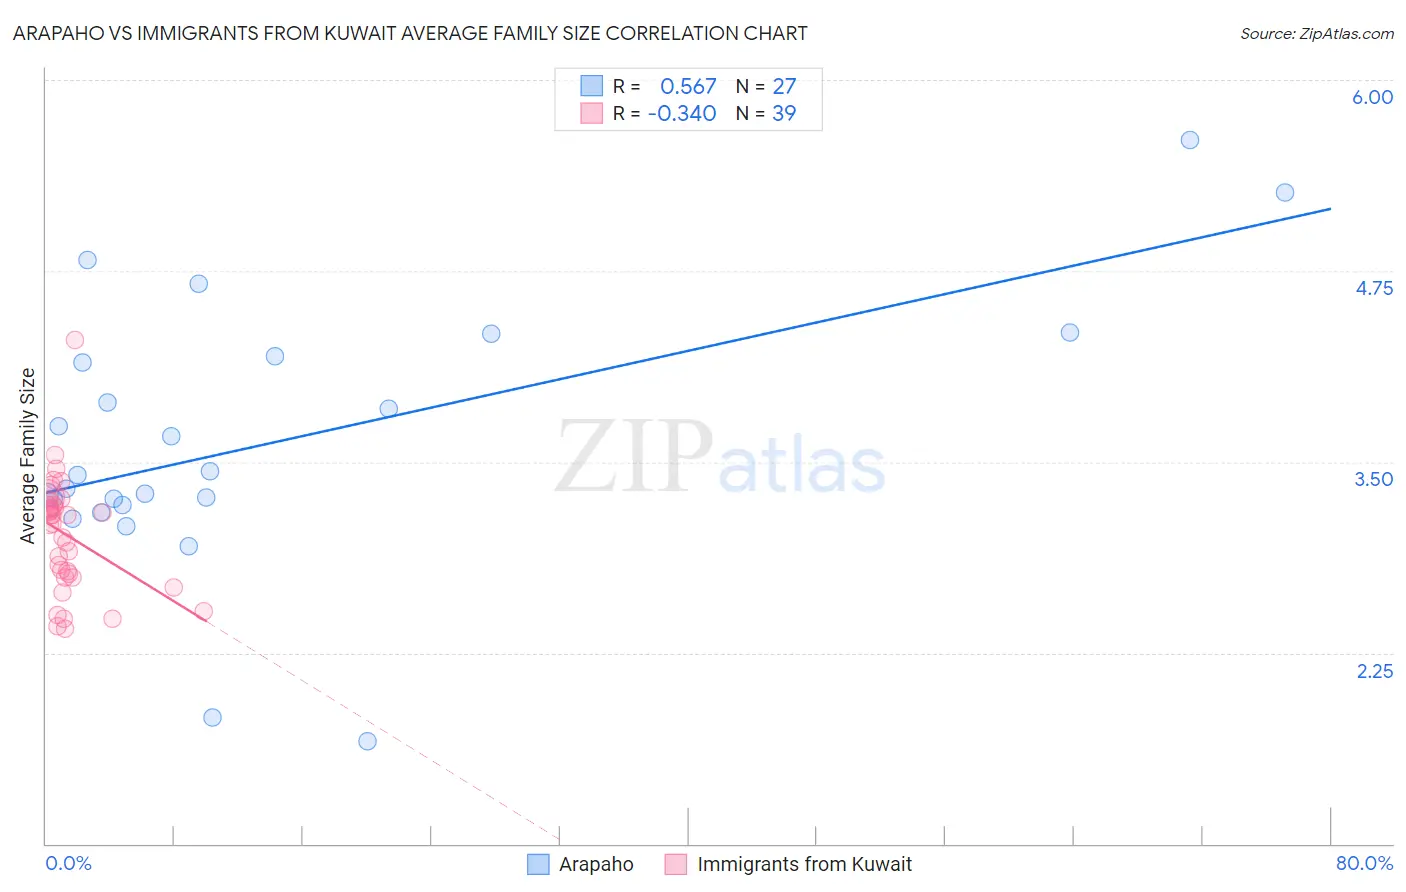
Arapaho vs Immigrants from Kuwait Average Family Size Correlation Chart
The statistical analysis conducted on geographies consisting of 29,778,233 people shows a substantial positive correlation between the proportion of Arapaho and average family size in the United States with a correlation coefficient (R) of 0.567 and weighted average of 3.64. Similarly, the statistical analysis conducted on geographies consisting of 136,887,006 people shows a mild negative correlation between the proportion of Immigrants from Kuwait and average family size in the United States with a correlation coefficient (R) of -0.340 and weighted average of 3.19, a difference of 13.9%.
Average Family Size Correlation Summary
| Measurement | Arapaho | Immigrants from Kuwait |
| Minimum | 1.67 | 2.41 |
| Maximum | 5.61 | 4.30 |
| Range | 3.94 | 1.89 |
| Mean | 3.63 | 3.02 |
| Median | 3.42 | 3.09 |
| Interquartile 25% (IQ1) | 3.22 | 2.74 |
| Interquartile 75% (IQ3) | 4.19 | 3.21 |
| Interquartile Range (IQR) | 0.97 | 0.47 |
| Standard Deviation (Sample) | 0.88 | 0.38 |
| Standard Deviation (Population) | 0.86 | 0.37 |
Similar Demographics by Average Family Size
Demographics Similar to Arapaho by Average Family Size
In terms of average family size, the demographic groups most similar to Arapaho are Inupiat (3.63, a difference of 0.22%), Navajo (3.65, a difference of 0.27%), Immigrants from Yemen (3.60, a difference of 1.1%), Hopi (3.60, a difference of 1.1%), and Spanish American Indian (3.58, a difference of 1.4%).
| Demographics | Rating | Rank | Average Family Size |
| Yup'ik | 100 /100 | #1 | Exceptional 4.00 |
| Crow | 100 /100 | #2 | Exceptional 3.82 |
| Pueblo | 100 /100 | #3 | Exceptional 3.79 |
| Pima | 100 /100 | #4 | Exceptional 3.75 |
| Navajo | 100.0 /100 | #5 | Exceptional 3.65 |
| Arapaho | 100.0 /100 | #6 | Exceptional 3.64 |
| Inupiat | 100.0 /100 | #7 | Exceptional 3.63 |
| Immigrants | Yemen | 100.0 /100 | #8 | Exceptional 3.60 |
| Hopi | 100.0 /100 | #9 | Exceptional 3.60 |
| Spanish American Indians | 100.0 /100 | #10 | Exceptional 3.58 |
| Tohono O'odham | 100.0 /100 | #11 | Exceptional 3.53 |
| Immigrants | Mexico | 100.0 /100 | #12 | Exceptional 3.52 |
| Sioux | 100.0 /100 | #13 | Exceptional 3.52 |
| Immigrants | Central America | 100.0 /100 | #14 | Exceptional 3.49 |
| Tongans | 100.0 /100 | #15 | Exceptional 3.49 |
Demographics Similar to Immigrants from Kuwait by Average Family Size
In terms of average family size, the demographic groups most similar to Immigrants from Kuwait are Immigrants from Ukraine (3.19, a difference of 0.0%), Immigrants from Zimbabwe (3.19, a difference of 0.010%), Syrian (3.19, a difference of 0.050%), Cree (3.19, a difference of 0.070%), and Chickasaw (3.19, a difference of 0.090%).
| Demographics | Rating | Rank | Average Family Size |
| Delaware | 11.1 /100 | #215 | Poor 3.20 |
| Bermudans | 11.0 /100 | #216 | Poor 3.20 |
| Immigrants | Somalia | 10.3 /100 | #217 | Poor 3.20 |
| French American Indians | 9.8 /100 | #218 | Tragic 3.20 |
| Pennsylvania Germans | 9.3 /100 | #219 | Tragic 3.19 |
| Lebanese | 9.1 /100 | #220 | Tragic 3.19 |
| Immigrants | Ukraine | 7.2 /100 | #221 | Tragic 3.19 |
| Immigrants | Kuwait | 7.2 /100 | #222 | Tragic 3.19 |
| Immigrants | Zimbabwe | 7.1 /100 | #223 | Tragic 3.19 |
| Syrians | 6.5 /100 | #224 | Tragic 3.19 |
| Cree | 6.2 /100 | #225 | Tragic 3.19 |
| Chickasaw | 6.0 /100 | #226 | Tragic 3.19 |
| Portuguese | 6.0 /100 | #227 | Tragic 3.19 |
| Immigrants | Nonimmigrants | 5.7 /100 | #228 | Tragic 3.19 |
| Immigrants | Italy | 5.3 /100 | #229 | Tragic 3.19 |