Immigrants from Poland vs Immigrants from Kuwait Average Family Size
COMPARE
Immigrants from Poland
Immigrants from Kuwait
Average Family Size
Average Family Size Comparison
Immigrants from Poland
Immigrants from Kuwait
3.20
AVERAGE FAMILY SIZE
16.6/ 100
METRIC RATING
204th/ 347
METRIC RANK
3.19
AVERAGE FAMILY SIZE
7.2/ 100
METRIC RATING
222nd/ 347
METRIC RANK
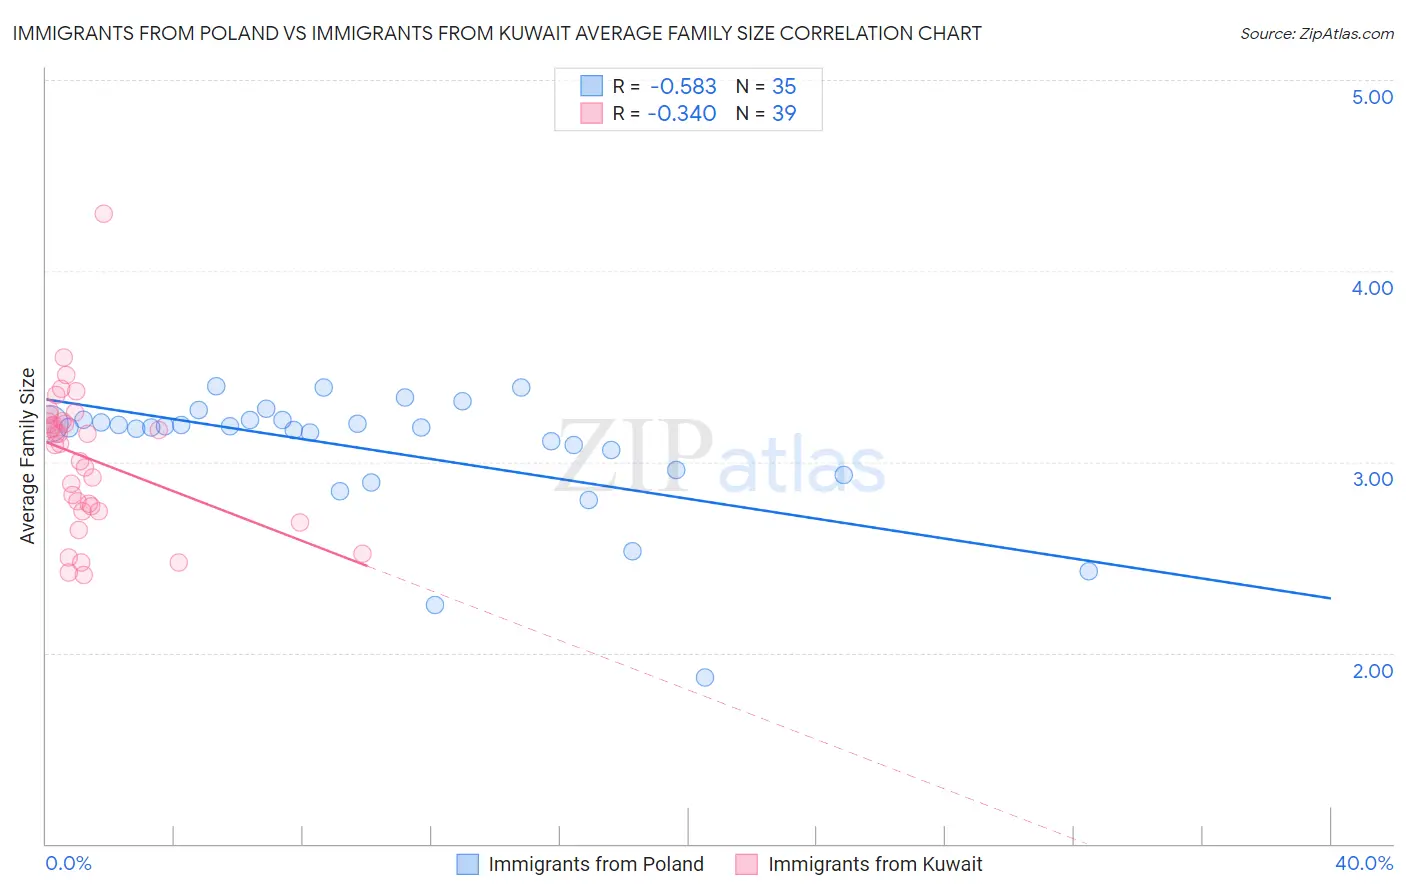
Immigrants from Poland vs Immigrants from Kuwait Average Family Size Correlation Chart
The statistical analysis conducted on geographies consisting of 304,786,853 people shows a substantial negative correlation between the proportion of Immigrants from Poland and average family size in the United States with a correlation coefficient (R) of -0.583 and weighted average of 3.20. Similarly, the statistical analysis conducted on geographies consisting of 136,887,006 people shows a mild negative correlation between the proportion of Immigrants from Kuwait and average family size in the United States with a correlation coefficient (R) of -0.340 and weighted average of 3.19, a difference of 0.44%.
Average Family Size Correlation Summary
| Measurement | Immigrants from Poland | Immigrants from Kuwait |
| Minimum | 1.87 | 2.41 |
| Maximum | 3.39 | 4.30 |
| Range | 1.52 | 1.89 |
| Mean | 3.06 | 3.02 |
| Median | 3.18 | 3.09 |
| Interquartile 25% (IQ1) | 2.96 | 2.74 |
| Interquartile 75% (IQ3) | 3.22 | 3.21 |
| Interquartile Range (IQR) | 0.26 | 0.47 |
| Standard Deviation (Sample) | 0.33 | 0.38 |
| Standard Deviation (Population) | 0.33 | 0.37 |
Demographics Similar to Immigrants from Poland and Immigrants from Kuwait by Average Family Size
In terms of average family size, the demographic groups most similar to Immigrants from Poland are Paraguayan (3.20, a difference of 0.010%), Immigrants from Cabo Verde (3.20, a difference of 0.020%), Immigrants from Nepal (3.21, a difference of 0.050%), Filipino (3.20, a difference of 0.11%), and Chippewa (3.20, a difference of 0.12%). Similarly, the demographic groups most similar to Immigrants from Kuwait are Immigrants from Ukraine (3.19, a difference of 0.0%), Immigrants from Zimbabwe (3.19, a difference of 0.010%), Lebanese (3.19, a difference of 0.12%), Pennsylvania German (3.19, a difference of 0.13%), and French American Indian (3.20, a difference of 0.15%).
| Demographics | Rating | Rank | Average Family Size |
| Immigrants | Nepal | 18.1 /100 | #203 | Poor 3.21 |
| Immigrants | Poland | 16.6 /100 | #204 | Poor 3.20 |
| Paraguayans | 16.3 /100 | #205 | Poor 3.20 |
| Immigrants | Cabo Verde | 16.0 /100 | #206 | Poor 3.20 |
| Filipinos | 13.6 /100 | #207 | Poor 3.20 |
| Chippewa | 13.3 /100 | #208 | Poor 3.20 |
| Sudanese | 13.3 /100 | #209 | Poor 3.20 |
| Zimbabweans | 12.6 /100 | #210 | Poor 3.20 |
| Immigrants | Iran | 12.1 /100 | #211 | Poor 3.20 |
| Creek | 12.1 /100 | #212 | Poor 3.20 |
| Mongolians | 11.5 /100 | #213 | Poor 3.20 |
| Somalis | 11.2 /100 | #214 | Poor 3.20 |
| Delaware | 11.1 /100 | #215 | Poor 3.20 |
| Bermudans | 11.0 /100 | #216 | Poor 3.20 |
| Immigrants | Somalia | 10.3 /100 | #217 | Poor 3.20 |
| French American Indians | 9.8 /100 | #218 | Tragic 3.20 |
| Pennsylvania Germans | 9.3 /100 | #219 | Tragic 3.19 |
| Lebanese | 9.1 /100 | #220 | Tragic 3.19 |
| Immigrants | Ukraine | 7.2 /100 | #221 | Tragic 3.19 |
| Immigrants | Kuwait | 7.2 /100 | #222 | Tragic 3.19 |
| Immigrants | Zimbabwe | 7.1 /100 | #223 | Tragic 3.19 |