Ute vs Immigrants from Croatia Divorced or Separated
COMPARE
Ute
Immigrants from Croatia
Divorced or Separated
Divorced or Separated Comparison
Ute
Immigrants from Croatia
12.6%
DIVORCED OR SEPARATED
0.4/ 100
METRIC RATING
270th/ 347
METRIC RANK
11.6%
DIVORCED OR SEPARATED
98.3/ 100
METRIC RATING
102nd/ 347
METRIC RANK
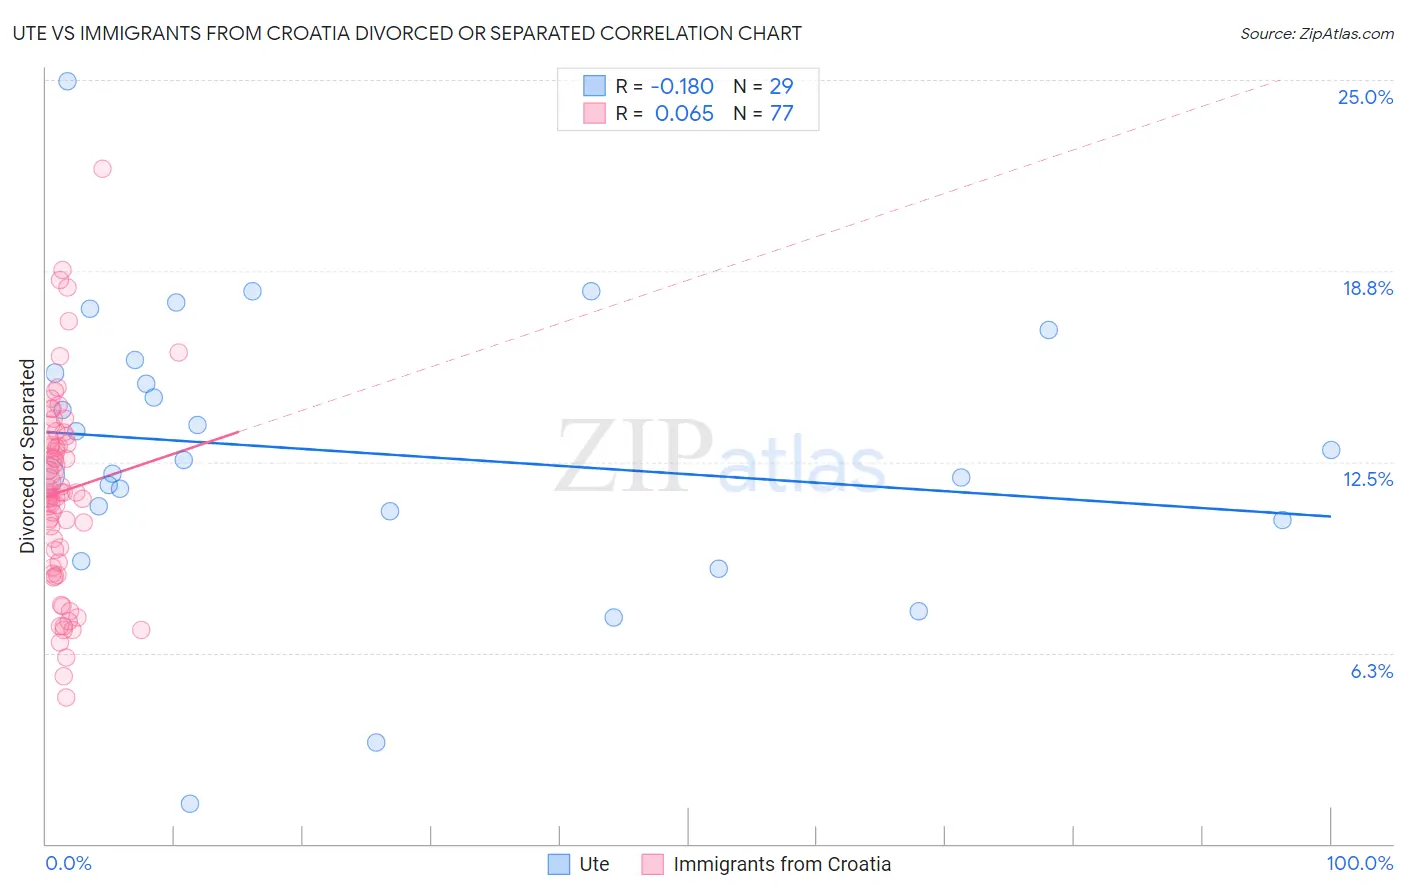
Ute vs Immigrants from Croatia Divorced or Separated Correlation Chart
The statistical analysis conducted on geographies consisting of 55,667,313 people shows a poor negative correlation between the proportion of Ute and percentage of population currently divorced or separated in the United States with a correlation coefficient (R) of -0.180 and weighted average of 12.6%. Similarly, the statistical analysis conducted on geographies consisting of 132,566,764 people shows a slight positive correlation between the proportion of Immigrants from Croatia and percentage of population currently divorced or separated in the United States with a correlation coefficient (R) of 0.065 and weighted average of 11.6%, a difference of 8.7%.
Divorced or Separated Correlation Summary
| Measurement | Ute | Immigrants from Croatia |
| Minimum | 1.3% | 4.8% |
| Maximum | 24.9% | 22.1% |
| Range | 23.6% | 17.3% |
| Mean | 12.8% | 11.5% |
| Median | 12.6% | 11.5% |
| Interquartile 25% (IQ1) | 10.7% | 9.1% |
| Interquartile 75% (IQ3) | 15.6% | 13.3% |
| Interquartile Range (IQR) | 4.9% | 4.1% |
| Standard Deviation (Sample) | 4.7% | 3.3% |
| Standard Deviation (Population) | 4.6% | 3.2% |
Similar Demographics by Divorced or Separated
Demographics Similar to Ute by Divorced or Separated
In terms of divorced or separated, the demographic groups most similar to Ute are Panamanian (12.7%, a difference of 0.060%), Immigrants from Middle Africa (12.7%, a difference of 0.11%), Immigrants from Liberia (12.6%, a difference of 0.12%), Fijian (12.6%, a difference of 0.13%), and Scottish (12.6%, a difference of 0.14%).
| Demographics | Rating | Rank | Divorced or Separated |
| Immigrants | Panama | 0.5 /100 | #263 | Tragic 12.6% |
| English | 0.5 /100 | #264 | Tragic 12.6% |
| Immigrants | Senegal | 0.5 /100 | #265 | Tragic 12.6% |
| Whites/Caucasians | 0.5 /100 | #266 | Tragic 12.6% |
| Scottish | 0.4 /100 | #267 | Tragic 12.6% |
| Fijians | 0.4 /100 | #268 | Tragic 12.6% |
| Immigrants | Liberia | 0.4 /100 | #269 | Tragic 12.6% |
| Ute | 0.4 /100 | #270 | Tragic 12.6% |
| Panamanians | 0.3 /100 | #271 | Tragic 12.7% |
| Immigrants | Middle Africa | 0.3 /100 | #272 | Tragic 12.7% |
| Immigrants | Micronesia | 0.3 /100 | #273 | Tragic 12.7% |
| Bermudans | 0.3 /100 | #274 | Tragic 12.7% |
| Central American Indians | 0.3 /100 | #275 | Tragic 12.7% |
| Spaniards | 0.2 /100 | #276 | Tragic 12.7% |
| Dominicans | 0.2 /100 | #277 | Tragic 12.7% |
Demographics Similar to Immigrants from Croatia by Divorced or Separated
In terms of divorced or separated, the demographic groups most similar to Immigrants from Croatia are Maltese (11.6%, a difference of 0.040%), Salvadoran (11.6%, a difference of 0.050%), Immigrants from Guyana (11.6%, a difference of 0.14%), Immigrants from Northern Europe (11.6%, a difference of 0.17%), and Immigrants from El Salvador (11.7%, a difference of 0.18%).
| Demographics | Rating | Rank | Divorced or Separated |
| Immigrants | Serbia | 98.8 /100 | #95 | Exceptional 11.6% |
| Immigrants | Ukraine | 98.7 /100 | #96 | Exceptional 11.6% |
| Latvians | 98.7 /100 | #97 | Exceptional 11.6% |
| Immigrants | Jordan | 98.6 /100 | #98 | Exceptional 11.6% |
| Immigrants | Sweden | 98.6 /100 | #99 | Exceptional 11.6% |
| Immigrants | Northern Europe | 98.6 /100 | #100 | Exceptional 11.6% |
| Immigrants | Guyana | 98.5 /100 | #101 | Exceptional 11.6% |
| Immigrants | Croatia | 98.3 /100 | #102 | Exceptional 11.6% |
| Maltese | 98.2 /100 | #103 | Exceptional 11.6% |
| Salvadorans | 98.2 /100 | #104 | Exceptional 11.6% |
| Immigrants | El Salvador | 97.9 /100 | #105 | Exceptional 11.7% |
| Immigrants | Kazakhstan | 97.8 /100 | #106 | Exceptional 11.7% |
| Native Hawaiians | 97.2 /100 | #107 | Exceptional 11.7% |
| Greeks | 96.9 /100 | #108 | Exceptional 11.7% |
| Immigrants | South Africa | 96.9 /100 | #109 | Exceptional 11.7% |