Taiwanese vs Immigrants from Croatia Divorced or Separated
COMPARE
Taiwanese
Immigrants from Croatia
Divorced or Separated
Divorced or Separated Comparison
Taiwanese
Immigrants from Croatia
11.5%
DIVORCED OR SEPARATED
99.6/ 100
METRIC RATING
74th/ 347
METRIC RANK
11.6%
DIVORCED OR SEPARATED
98.3/ 100
METRIC RATING
102nd/ 347
METRIC RANK
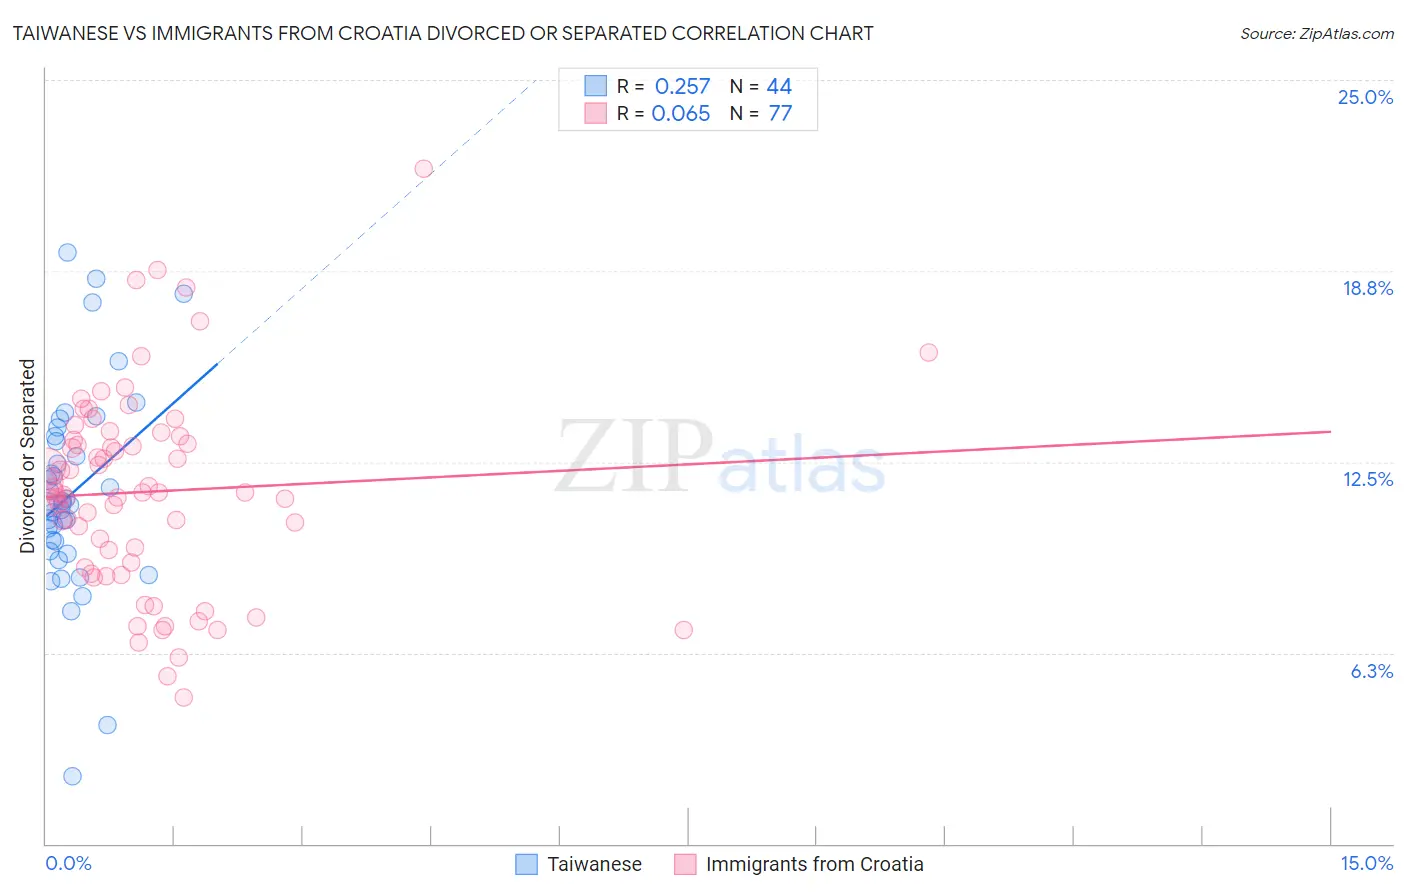
Taiwanese vs Immigrants from Croatia Divorced or Separated Correlation Chart
The statistical analysis conducted on geographies consisting of 31,709,765 people shows a weak positive correlation between the proportion of Taiwanese and percentage of population currently divorced or separated in the United States with a correlation coefficient (R) of 0.257 and weighted average of 11.5%. Similarly, the statistical analysis conducted on geographies consisting of 132,566,764 people shows a slight positive correlation between the proportion of Immigrants from Croatia and percentage of population currently divorced or separated in the United States with a correlation coefficient (R) of 0.065 and weighted average of 11.6%, a difference of 1.4%.
Divorced or Separated Correlation Summary
| Measurement | Taiwanese | Immigrants from Croatia |
| Minimum | 2.2% | 4.8% |
| Maximum | 19.3% | 22.1% |
| Range | 17.1% | 17.3% |
| Mean | 11.5% | 11.5% |
| Median | 11.1% | 11.5% |
| Interquartile 25% (IQ1) | 9.7% | 9.1% |
| Interquartile 75% (IQ3) | 13.3% | 13.3% |
| Interquartile Range (IQR) | 3.5% | 4.1% |
| Standard Deviation (Sample) | 3.3% | 3.3% |
| Standard Deviation (Population) | 3.3% | 3.2% |
Similar Demographics by Divorced or Separated
Demographics Similar to Taiwanese by Divorced or Separated
In terms of divorced or separated, the demographic groups most similar to Taiwanese are Jordanian (11.5%, a difference of 0.060%), Immigrants from North Macedonia (11.5%, a difference of 0.060%), Immigrants from Northern Africa (11.5%, a difference of 0.080%), Albanian (11.5%, a difference of 0.10%), and Paraguayan (11.5%, a difference of 0.13%).
| Demographics | Rating | Rank | Divorced or Separated |
| Immigrants | Syria | 99.7 /100 | #67 | Exceptional 11.4% |
| Palestinians | 99.7 /100 | #68 | Exceptional 11.5% |
| Immigrants | Belgium | 99.7 /100 | #69 | Exceptional 11.5% |
| Immigrants | Eastern Europe | 99.7 /100 | #70 | Exceptional 11.5% |
| Paraguayans | 99.7 /100 | #71 | Exceptional 11.5% |
| Jordanians | 99.6 /100 | #72 | Exceptional 11.5% |
| Immigrants | North Macedonia | 99.6 /100 | #73 | Exceptional 11.5% |
| Taiwanese | 99.6 /100 | #74 | Exceptional 11.5% |
| Immigrants | Northern Africa | 99.6 /100 | #75 | Exceptional 11.5% |
| Albanians | 99.6 /100 | #76 | Exceptional 11.5% |
| Immigrants | Italy | 99.5 /100 | #77 | Exceptional 11.5% |
| Afghans | 99.4 /100 | #78 | Exceptional 11.5% |
| Guyanese | 99.4 /100 | #79 | Exceptional 11.5% |
| Immigrants | Switzerland | 99.4 /100 | #80 | Exceptional 11.5% |
| Russians | 99.4 /100 | #81 | Exceptional 11.5% |
Demographics Similar to Immigrants from Croatia by Divorced or Separated
In terms of divorced or separated, the demographic groups most similar to Immigrants from Croatia are Maltese (11.6%, a difference of 0.040%), Salvadoran (11.6%, a difference of 0.050%), Immigrants from Guyana (11.6%, a difference of 0.14%), Immigrants from Northern Europe (11.6%, a difference of 0.17%), and Immigrants from El Salvador (11.7%, a difference of 0.18%).
| Demographics | Rating | Rank | Divorced or Separated |
| Immigrants | Serbia | 98.8 /100 | #95 | Exceptional 11.6% |
| Immigrants | Ukraine | 98.7 /100 | #96 | Exceptional 11.6% |
| Latvians | 98.7 /100 | #97 | Exceptional 11.6% |
| Immigrants | Jordan | 98.6 /100 | #98 | Exceptional 11.6% |
| Immigrants | Sweden | 98.6 /100 | #99 | Exceptional 11.6% |
| Immigrants | Northern Europe | 98.6 /100 | #100 | Exceptional 11.6% |
| Immigrants | Guyana | 98.5 /100 | #101 | Exceptional 11.6% |
| Immigrants | Croatia | 98.3 /100 | #102 | Exceptional 11.6% |
| Maltese | 98.2 /100 | #103 | Exceptional 11.6% |
| Salvadorans | 98.2 /100 | #104 | Exceptional 11.6% |
| Immigrants | El Salvador | 97.9 /100 | #105 | Exceptional 11.7% |
| Immigrants | Kazakhstan | 97.8 /100 | #106 | Exceptional 11.7% |
| Native Hawaiians | 97.2 /100 | #107 | Exceptional 11.7% |
| Greeks | 96.9 /100 | #108 | Exceptional 11.7% |
| Immigrants | South Africa | 96.9 /100 | #109 | Exceptional 11.7% |