Assyrian/Chaldean/Syriac vs Cypriot Family Households with Children
COMPARE
Assyrian/Chaldean/Syriac
Cypriot
Family Households with Children
Family Households with Children Comparison
Assyrians/Chaldeans/Syriacs
Cypriots
28.1%
FAMILY HOUSEHOLDS WITH CHILDREN
98.7/ 100
METRIC RATING
102nd/ 347
METRIC RANK
25.9%
FAMILY HOUSEHOLDS WITH CHILDREN
0.0/ 100
METRIC RATING
329th/ 347
METRIC RANK
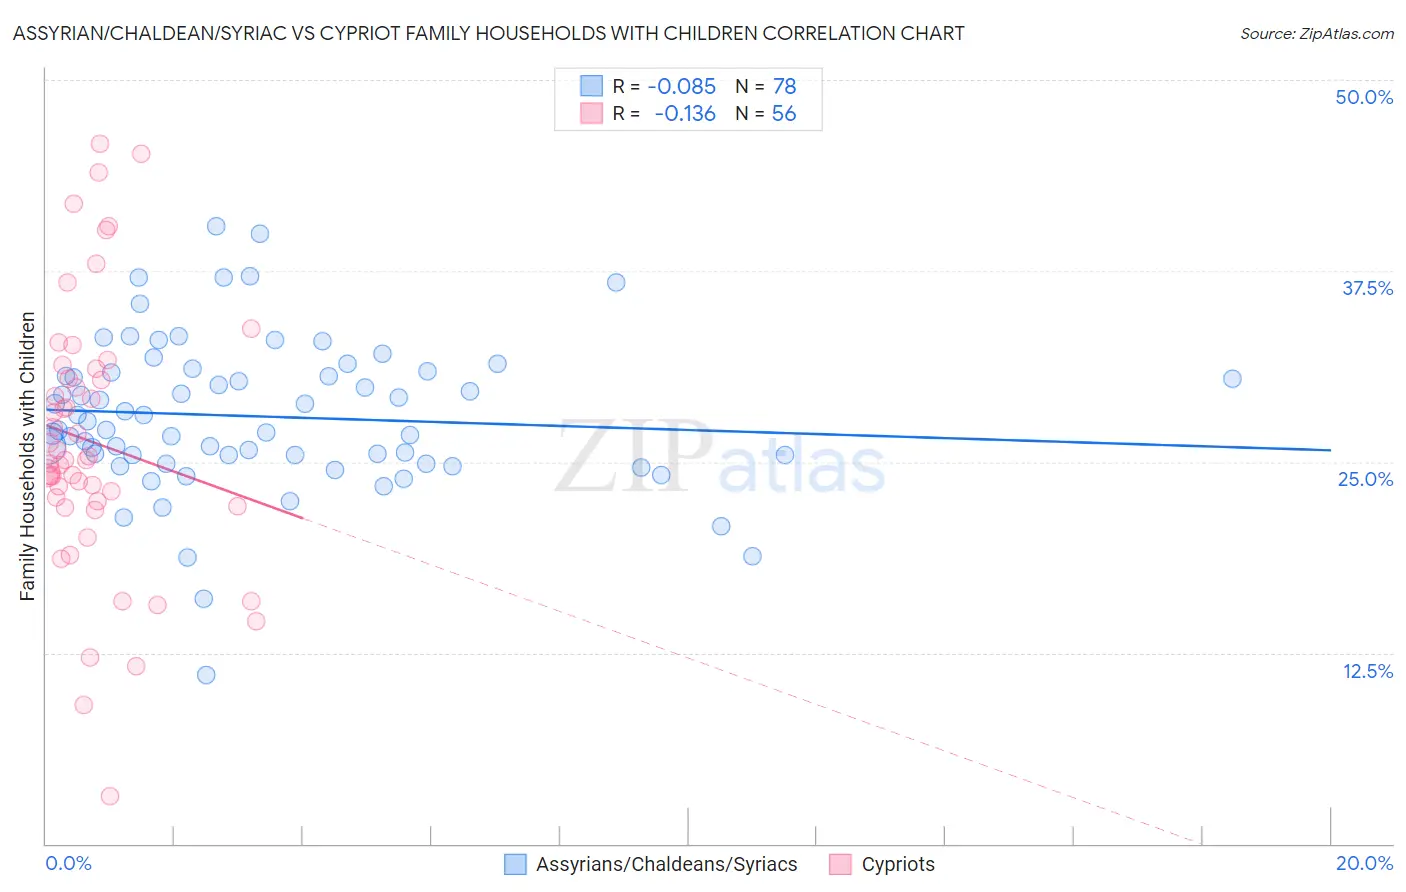
Assyrian/Chaldean/Syriac vs Cypriot Family Households with Children Correlation Chart
The statistical analysis conducted on geographies consisting of 110,282,118 people shows a slight negative correlation between the proportion of Assyrians/Chaldeans/Syriacs and percentage of family households with children in the United States with a correlation coefficient (R) of -0.085 and weighted average of 28.1%. Similarly, the statistical analysis conducted on geographies consisting of 61,838,668 people shows a poor negative correlation between the proportion of Cypriots and percentage of family households with children in the United States with a correlation coefficient (R) of -0.136 and weighted average of 25.9%, a difference of 8.5%.
Family Households with Children Correlation Summary
| Measurement | Assyrian/Chaldean/Syriac | Cypriot |
| Minimum | 11.1% | 3.1% |
| Maximum | 40.5% | 45.8% |
| Range | 29.4% | 42.7% |
| Mean | 28.0% | 26.3% |
| Median | 27.4% | 25.1% |
| Interquartile 25% (IQ1) | 25.4% | 22.3% |
| Interquartile 75% (IQ3) | 30.8% | 30.8% |
| Interquartile Range (IQR) | 5.4% | 8.5% |
| Standard Deviation (Sample) | 5.0% | 8.8% |
| Standard Deviation (Population) | 5.0% | 8.7% |
Similar Demographics by Family Households with Children
Demographics Similar to Assyrians/Chaldeans/Syriacs by Family Households with Children
In terms of family households with children, the demographic groups most similar to Assyrians/Chaldeans/Syriacs are Immigrants from Oceania (28.1%, a difference of 0.030%), Immigrants from the Azores (28.1%, a difference of 0.050%), Indonesian (28.1%, a difference of 0.050%), Immigrants from Kenya (28.1%, a difference of 0.060%), and Chilean (28.1%, a difference of 0.10%).
| Demographics | Rating | Rank | Family Households with Children |
| Immigrants | Nicaragua | 99.1 /100 | #95 | Exceptional 28.2% |
| Ute | 99.1 /100 | #96 | Exceptional 28.2% |
| Chileans | 98.9 /100 | #97 | Exceptional 28.1% |
| Immigrants | Kenya | 98.9 /100 | #98 | Exceptional 28.1% |
| Immigrants | Azores | 98.8 /100 | #99 | Exceptional 28.1% |
| Indonesians | 98.8 /100 | #100 | Exceptional 28.1% |
| Immigrants | Oceania | 98.8 /100 | #101 | Exceptional 28.1% |
| Assyrians/Chaldeans/Syriacs | 98.7 /100 | #102 | Exceptional 28.1% |
| Palestinians | 98.5 /100 | #103 | Exceptional 28.1% |
| Sioux | 98.3 /100 | #104 | Exceptional 28.1% |
| Choctaw | 98.3 /100 | #105 | Exceptional 28.1% |
| Immigrants | South America | 98.0 /100 | #106 | Exceptional 28.0% |
| Immigrants | Uganda | 97.7 /100 | #107 | Exceptional 28.0% |
| Immigrants | Burma/Myanmar | 97.7 /100 | #108 | Exceptional 28.0% |
| Tohono O'odham | 97.6 /100 | #109 | Exceptional 28.0% |
Demographics Similar to Cypriots by Family Households with Children
In terms of family households with children, the demographic groups most similar to Cypriots are Immigrants from Albania (25.9%, a difference of 0.13%), Immigrants from Latvia (25.9%, a difference of 0.18%), Immigrants from Barbados (26.0%, a difference of 0.23%), Slovene (25.8%, a difference of 0.31%), and Immigrants from Ireland (26.0%, a difference of 0.33%).
| Demographics | Rating | Rank | Family Households with Children |
| Immigrants | Greece | 0.0 /100 | #322 | Tragic 26.0% |
| Immigrants | Australia | 0.0 /100 | #323 | Tragic 26.0% |
| Chinese | 0.0 /100 | #324 | Tragic 26.0% |
| Barbadians | 0.0 /100 | #325 | Tragic 26.0% |
| Immigrants | Ireland | 0.0 /100 | #326 | Tragic 26.0% |
| Immigrants | Barbados | 0.0 /100 | #327 | Tragic 26.0% |
| Immigrants | Albania | 0.0 /100 | #328 | Tragic 25.9% |
| Cypriots | 0.0 /100 | #329 | Tragic 25.9% |
| Immigrants | Latvia | 0.0 /100 | #330 | Tragic 25.9% |
| Slovenes | 0.0 /100 | #331 | Tragic 25.8% |
| Immigrants | Austria | 0.0 /100 | #332 | Tragic 25.8% |
| Immigrants | Switzerland | 0.0 /100 | #333 | Tragic 25.7% |
| Slovaks | 0.0 /100 | #334 | Tragic 25.7% |
| Immigrants | Croatia | 0.0 /100 | #335 | Tragic 25.7% |
| Immigrants | West Indies | 0.0 /100 | #336 | Tragic 25.7% |