Assyrian/Chaldean/Syriac vs Bangladeshi Family Households with Children
COMPARE
Assyrian/Chaldean/Syriac
Bangladeshi
Family Households with Children
Family Households with Children Comparison
Assyrians/Chaldeans/Syriacs
Bangladeshis
28.1%
FAMILY HOUSEHOLDS WITH CHILDREN
98.7/ 100
METRIC RATING
102nd/ 347
METRIC RANK
30.1%
FAMILY HOUSEHOLDS WITH CHILDREN
100.0/ 100
METRIC RATING
14th/ 347
METRIC RANK
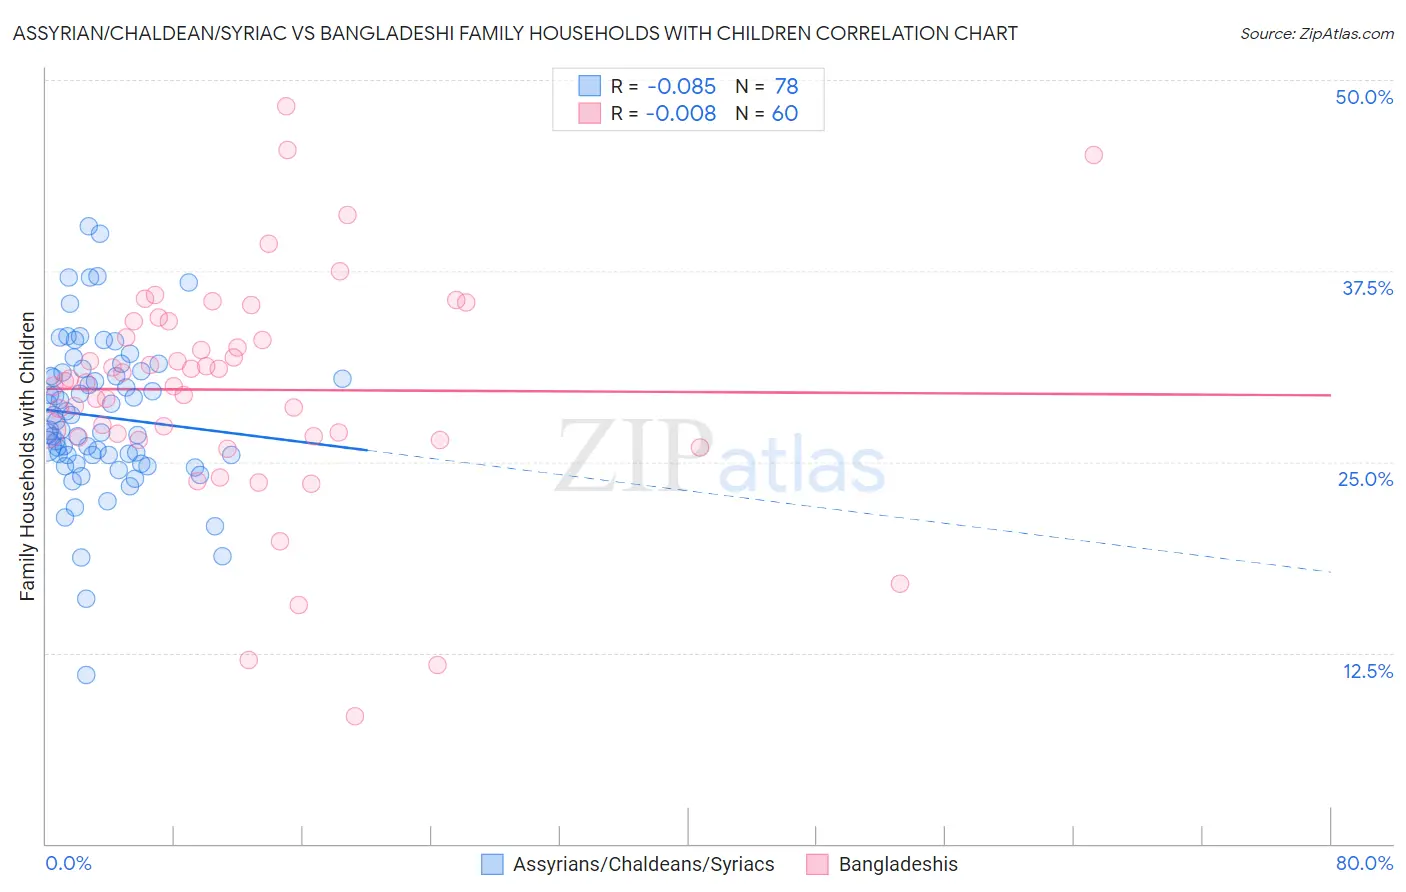
Assyrian/Chaldean/Syriac vs Bangladeshi Family Households with Children Correlation Chart
The statistical analysis conducted on geographies consisting of 110,282,118 people shows a slight negative correlation between the proportion of Assyrians/Chaldeans/Syriacs and percentage of family households with children in the United States with a correlation coefficient (R) of -0.085 and weighted average of 28.1%. Similarly, the statistical analysis conducted on geographies consisting of 141,328,833 people shows no correlation between the proportion of Bangladeshis and percentage of family households with children in the United States with a correlation coefficient (R) of -0.008 and weighted average of 30.1%, a difference of 7.1%.
Family Households with Children Correlation Summary
| Measurement | Assyrian/Chaldean/Syriac | Bangladeshi |
| Minimum | 11.1% | 8.3% |
| Maximum | 40.5% | 48.3% |
| Range | 29.4% | 39.9% |
| Mean | 28.0% | 29.7% |
| Median | 27.4% | 30.2% |
| Interquartile 25% (IQ1) | 25.4% | 26.6% |
| Interquartile 75% (IQ3) | 30.8% | 33.7% |
| Interquartile Range (IQR) | 5.4% | 7.1% |
| Standard Deviation (Sample) | 5.0% | 7.4% |
| Standard Deviation (Population) | 5.0% | 7.4% |
Similar Demographics by Family Households with Children
Demographics Similar to Assyrians/Chaldeans/Syriacs by Family Households with Children
In terms of family households with children, the demographic groups most similar to Assyrians/Chaldeans/Syriacs are Immigrants from Oceania (28.1%, a difference of 0.030%), Immigrants from the Azores (28.1%, a difference of 0.050%), Indonesian (28.1%, a difference of 0.050%), Immigrants from Kenya (28.1%, a difference of 0.060%), and Chilean (28.1%, a difference of 0.10%).
| Demographics | Rating | Rank | Family Households with Children |
| Immigrants | Nicaragua | 99.1 /100 | #95 | Exceptional 28.2% |
| Ute | 99.1 /100 | #96 | Exceptional 28.2% |
| Chileans | 98.9 /100 | #97 | Exceptional 28.1% |
| Immigrants | Kenya | 98.9 /100 | #98 | Exceptional 28.1% |
| Immigrants | Azores | 98.8 /100 | #99 | Exceptional 28.1% |
| Indonesians | 98.8 /100 | #100 | Exceptional 28.1% |
| Immigrants | Oceania | 98.8 /100 | #101 | Exceptional 28.1% |
| Assyrians/Chaldeans/Syriacs | 98.7 /100 | #102 | Exceptional 28.1% |
| Palestinians | 98.5 /100 | #103 | Exceptional 28.1% |
| Sioux | 98.3 /100 | #104 | Exceptional 28.1% |
| Choctaw | 98.3 /100 | #105 | Exceptional 28.1% |
| Immigrants | South America | 98.0 /100 | #106 | Exceptional 28.0% |
| Immigrants | Uganda | 97.7 /100 | #107 | Exceptional 28.0% |
| Immigrants | Burma/Myanmar | 97.7 /100 | #108 | Exceptional 28.0% |
| Tohono O'odham | 97.6 /100 | #109 | Exceptional 28.0% |
Demographics Similar to Bangladeshis by Family Households with Children
In terms of family households with children, the demographic groups most similar to Bangladeshis are Immigrants from South Central Asia (30.0%, a difference of 0.17%), Immigrants from Afghanistan (30.0%, a difference of 0.20%), Afghan (30.2%, a difference of 0.28%), Immigrants from Pakistan (30.2%, a difference of 0.52%), and Hispanic or Latino (29.9%, a difference of 0.58%).
| Demographics | Rating | Rank | Family Households with Children |
| Immigrants | Central America | 100.0 /100 | #7 | Exceptional 31.0% |
| Yakama | 100.0 /100 | #8 | Exceptional 30.8% |
| Thais | 100.0 /100 | #9 | Exceptional 30.6% |
| Immigrants | Fiji | 100.0 /100 | #10 | Exceptional 30.5% |
| Nepalese | 100.0 /100 | #11 | Exceptional 30.5% |
| Immigrants | Pakistan | 100.0 /100 | #12 | Exceptional 30.2% |
| Afghans | 100.0 /100 | #13 | Exceptional 30.2% |
| Bangladeshis | 100.0 /100 | #14 | Exceptional 30.1% |
| Immigrants | South Central Asia | 100.0 /100 | #15 | Exceptional 30.0% |
| Immigrants | Afghanistan | 100.0 /100 | #16 | Exceptional 30.0% |
| Hispanics or Latinos | 100.0 /100 | #17 | Exceptional 29.9% |
| Salvadorans | 100.0 /100 | #18 | Exceptional 29.9% |
| Alaska Natives | 100.0 /100 | #19 | Exceptional 29.9% |
| Immigrants | El Salvador | 100.0 /100 | #20 | Exceptional 29.8% |
| Immigrants | Laos | 100.0 /100 | #21 | Exceptional 29.8% |