Immigrants from Kazakhstan vs Cypriot Family Households with Children
COMPARE
Immigrants from Kazakhstan
Cypriot
Family Households with Children
Family Households with Children Comparison
Immigrants from Kazakhstan
Cypriots
26.9%
FAMILY HOUSEHOLDS WITH CHILDREN
2.2/ 100
METRIC RATING
248th/ 347
METRIC RANK
25.9%
FAMILY HOUSEHOLDS WITH CHILDREN
0.0/ 100
METRIC RATING
329th/ 347
METRIC RANK
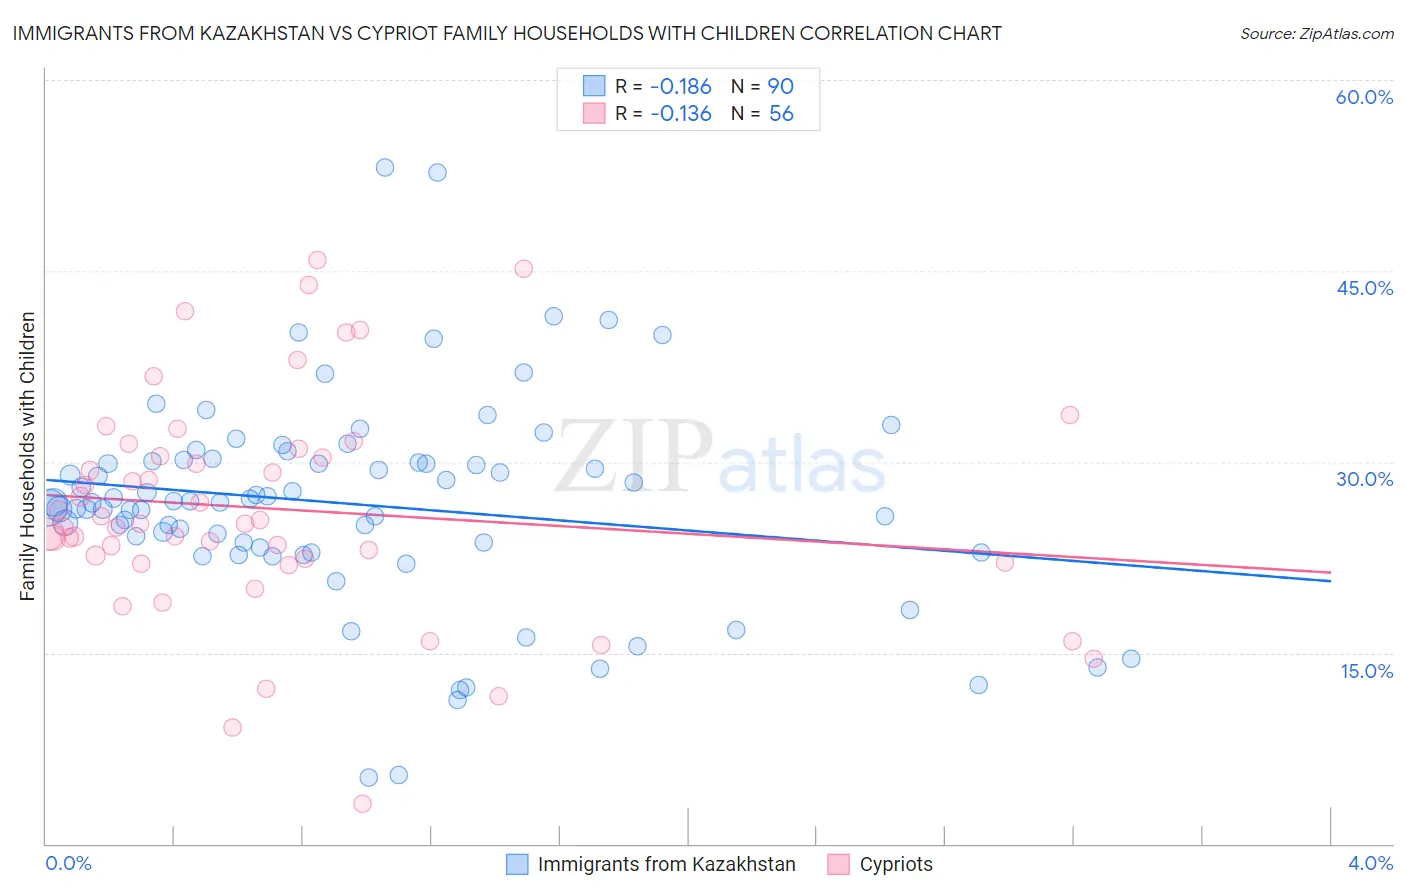
Immigrants from Kazakhstan vs Cypriot Family Households with Children Correlation Chart
The statistical analysis conducted on geographies consisting of 124,425,181 people shows a poor negative correlation between the proportion of Immigrants from Kazakhstan and percentage of family households with children in the United States with a correlation coefficient (R) of -0.186 and weighted average of 26.9%. Similarly, the statistical analysis conducted on geographies consisting of 61,838,668 people shows a poor negative correlation between the proportion of Cypriots and percentage of family households with children in the United States with a correlation coefficient (R) of -0.136 and weighted average of 25.9%, a difference of 3.8%.
Family Households with Children Correlation Summary
| Measurement | Immigrants from Kazakhstan | Cypriot |
| Minimum | 5.2% | 3.1% |
| Maximum | 53.2% | 45.8% |
| Range | 48.0% | 42.7% |
| Mean | 26.7% | 26.3% |
| Median | 26.8% | 25.1% |
| Interquartile 25% (IQ1) | 23.3% | 22.3% |
| Interquartile 75% (IQ3) | 30.0% | 30.8% |
| Interquartile Range (IQR) | 6.7% | 8.5% |
| Standard Deviation (Sample) | 8.2% | 8.8% |
| Standard Deviation (Population) | 8.2% | 8.7% |
Similar Demographics by Family Households with Children
Demographics Similar to Immigrants from Kazakhstan by Family Households with Children
In terms of family households with children, the demographic groups most similar to Immigrants from Kazakhstan are Potawatomi (26.9%, a difference of 0.010%), Immigrants from Eastern Europe (26.9%, a difference of 0.020%), Belgian (26.9%, a difference of 0.020%), Jamaican (26.9%, a difference of 0.070%), and Immigrants from Bosnia and Herzegovina (26.8%, a difference of 0.080%).
| Demographics | Rating | Rank | Family Households with Children |
| Navajo | 3.2 /100 | #241 | Tragic 26.9% |
| Immigrants | England | 3.2 /100 | #242 | Tragic 26.9% |
| Immigrants | Saudi Arabia | 2.9 /100 | #243 | Tragic 26.9% |
| Ukrainians | 2.9 /100 | #244 | Tragic 26.9% |
| Australians | 2.8 /100 | #245 | Tragic 26.9% |
| Jamaicans | 2.5 /100 | #246 | Tragic 26.9% |
| Potawatomi | 2.2 /100 | #247 | Tragic 26.9% |
| Immigrants | Kazakhstan | 2.2 /100 | #248 | Tragic 26.9% |
| Immigrants | Eastern Europe | 2.1 /100 | #249 | Tragic 26.9% |
| Belgians | 2.1 /100 | #250 | Tragic 26.9% |
| Immigrants | Bosnia and Herzegovina | 1.9 /100 | #251 | Tragic 26.8% |
| Irish | 1.8 /100 | #252 | Tragic 26.8% |
| Italians | 1.5 /100 | #253 | Tragic 26.8% |
| Immigrants | Scotland | 1.5 /100 | #254 | Tragic 26.8% |
| German Russians | 1.5 /100 | #255 | Tragic 26.8% |
Demographics Similar to Cypriots by Family Households with Children
In terms of family households with children, the demographic groups most similar to Cypriots are Immigrants from Albania (25.9%, a difference of 0.13%), Immigrants from Latvia (25.9%, a difference of 0.18%), Immigrants from Barbados (26.0%, a difference of 0.23%), Slovene (25.8%, a difference of 0.31%), and Immigrants from Ireland (26.0%, a difference of 0.33%).
| Demographics | Rating | Rank | Family Households with Children |
| Immigrants | Greece | 0.0 /100 | #322 | Tragic 26.0% |
| Immigrants | Australia | 0.0 /100 | #323 | Tragic 26.0% |
| Chinese | 0.0 /100 | #324 | Tragic 26.0% |
| Barbadians | 0.0 /100 | #325 | Tragic 26.0% |
| Immigrants | Ireland | 0.0 /100 | #326 | Tragic 26.0% |
| Immigrants | Barbados | 0.0 /100 | #327 | Tragic 26.0% |
| Immigrants | Albania | 0.0 /100 | #328 | Tragic 25.9% |
| Cypriots | 0.0 /100 | #329 | Tragic 25.9% |
| Immigrants | Latvia | 0.0 /100 | #330 | Tragic 25.9% |
| Slovenes | 0.0 /100 | #331 | Tragic 25.8% |
| Immigrants | Austria | 0.0 /100 | #332 | Tragic 25.8% |
| Immigrants | Switzerland | 0.0 /100 | #333 | Tragic 25.7% |
| Slovaks | 0.0 /100 | #334 | Tragic 25.7% |
| Immigrants | Croatia | 0.0 /100 | #335 | Tragic 25.7% |
| Immigrants | West Indies | 0.0 /100 | #336 | Tragic 25.7% |