Assyrian/Chaldean/Syriac vs Cypriot Unemployment Among Youth under 25 years
COMPARE
Assyrian/Chaldean/Syriac
Cypriot
Unemployment Among Youth under 25 years
Unemployment Among Youth under 25 years Comparison
Assyrians/Chaldeans/Syriacs
Cypriots
11.9%
UNEMPLOYMENT AMONG YOUTH UNDER 25 YEARS
9.8/ 100
METRIC RATING
210th/ 347
METRIC RANK
11.7%
UNEMPLOYMENT AMONG YOUTH UNDER 25 YEARS
28.5/ 100
METRIC RATING
191st/ 347
METRIC RANK
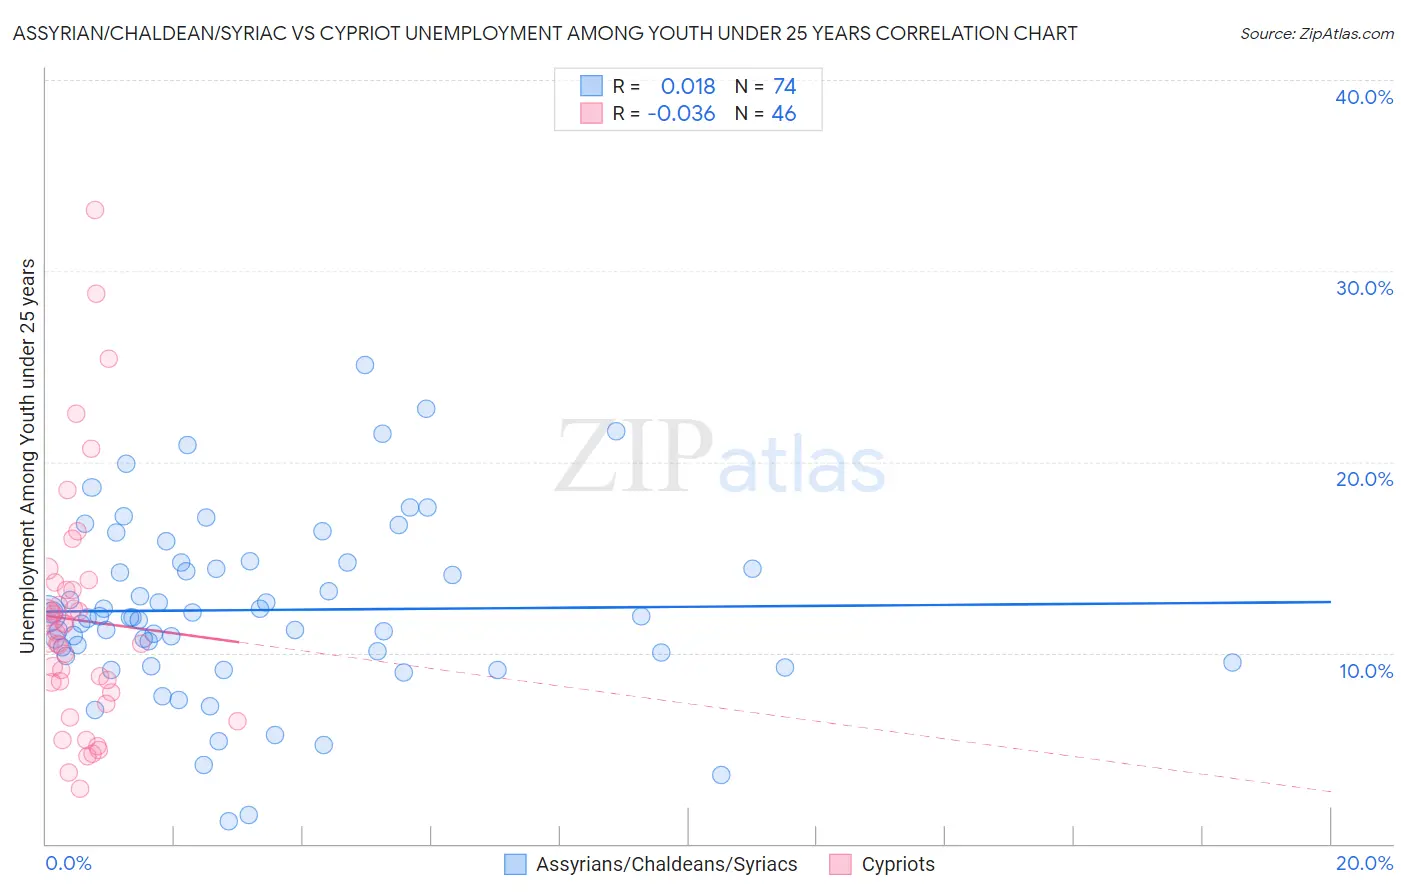
Assyrian/Chaldean/Syriac vs Cypriot Unemployment Among Youth under 25 years Correlation Chart
The statistical analysis conducted on geographies consisting of 109,923,358 people shows no correlation between the proportion of Assyrians/Chaldeans/Syriacs and unemployment rate among youth under the age of 25 in the United States with a correlation coefficient (R) of 0.018 and weighted average of 11.9%. Similarly, the statistical analysis conducted on geographies consisting of 61,631,800 people shows no correlation between the proportion of Cypriots and unemployment rate among youth under the age of 25 in the United States with a correlation coefficient (R) of -0.036 and weighted average of 11.7%, a difference of 1.3%.
Unemployment Among Youth under 25 years Correlation Summary
| Measurement | Assyrian/Chaldean/Syriac | Cypriot |
| Minimum | 1.2% | 2.9% |
| Maximum | 25.1% | 33.2% |
| Range | 23.9% | 30.3% |
| Mean | 12.2% | 11.7% |
| Median | 11.9% | 10.8% |
| Interquartile 25% (IQ1) | 9.8% | 8.0% |
| Interquartile 75% (IQ3) | 14.7% | 13.3% |
| Interquartile Range (IQR) | 4.9% | 5.4% |
| Standard Deviation (Sample) | 4.6% | 6.3% |
| Standard Deviation (Population) | 4.6% | 6.3% |
Demographics Similar to Assyrians/Chaldeans/Syriacs and Cypriots by Unemployment Among Youth under 25 years
In terms of unemployment among youth under 25 years, the demographic groups most similar to Assyrians/Chaldeans/Syriacs are Immigrants from Lebanon (11.8%, a difference of 0.15%), Comanche (11.8%, a difference of 0.23%), Immigrants from Southern Europe (11.8%, a difference of 0.25%), Immigrants from Pakistan (11.8%, a difference of 0.28%), and Peruvian (11.8%, a difference of 0.40%). Similarly, the demographic groups most similar to Cypriots are Immigrants from Russia (11.7%, a difference of 0.0%), Seminole (11.7%, a difference of 0.030%), Immigrants from Sri Lanka (11.7%, a difference of 0.040%), Paraguayan (11.7%, a difference of 0.070%), and Egyptian (11.7%, a difference of 0.080%).
| Demographics | Rating | Rank | Unemployment Among Youth under 25 years |
| Portuguese | 30.3 /100 | #190 | Fair 11.7% |
| Cypriots | 28.5 /100 | #191 | Fair 11.7% |
| Immigrants | Russia | 28.5 /100 | #192 | Fair 11.7% |
| Seminole | 27.9 /100 | #193 | Fair 11.7% |
| Immigrants | Sri Lanka | 27.8 /100 | #194 | Fair 11.7% |
| Paraguayans | 27.2 /100 | #195 | Fair 11.7% |
| Egyptians | 26.9 /100 | #196 | Fair 11.7% |
| Koreans | 23.9 /100 | #197 | Fair 11.7% |
| Cherokee | 21.2 /100 | #198 | Fair 11.8% |
| Immigrants | Colombia | 20.9 /100 | #199 | Fair 11.8% |
| Arabs | 18.0 /100 | #200 | Poor 11.8% |
| Palestinians | 16.0 /100 | #201 | Poor 11.8% |
| Marshallese | 15.8 /100 | #202 | Poor 11.8% |
| Immigrants | Peru | 15.3 /100 | #203 | Poor 11.8% |
| Immigrants | Costa Rica | 15.2 /100 | #204 | Poor 11.8% |
| Peruvians | 14.0 /100 | #205 | Poor 11.8% |
| Immigrants | Pakistan | 12.6 /100 | #206 | Poor 11.8% |
| Immigrants | Southern Europe | 12.3 /100 | #207 | Poor 11.8% |
| Comanche | 12.1 /100 | #208 | Poor 11.8% |
| Immigrants | Lebanon | 11.3 /100 | #209 | Poor 11.8% |
| Assyrians/Chaldeans/Syriacs | 9.8 /100 | #210 | Tragic 11.9% |