Assyrian/Chaldean/Syriac vs Immigrants from Israel Family Households with Children
COMPARE
Assyrian/Chaldean/Syriac
Immigrants from Israel
Family Households with Children
Family Households with Children Comparison
Assyrians/Chaldeans/Syriacs
Immigrants from Israel
28.1%
FAMILY HOUSEHOLDS WITH CHILDREN
98.7/ 100
METRIC RATING
102nd/ 347
METRIC RANK
27.4%
FAMILY HOUSEHOLDS WITH CHILDREN
37.9/ 100
METRIC RATING
189th/ 347
METRIC RANK
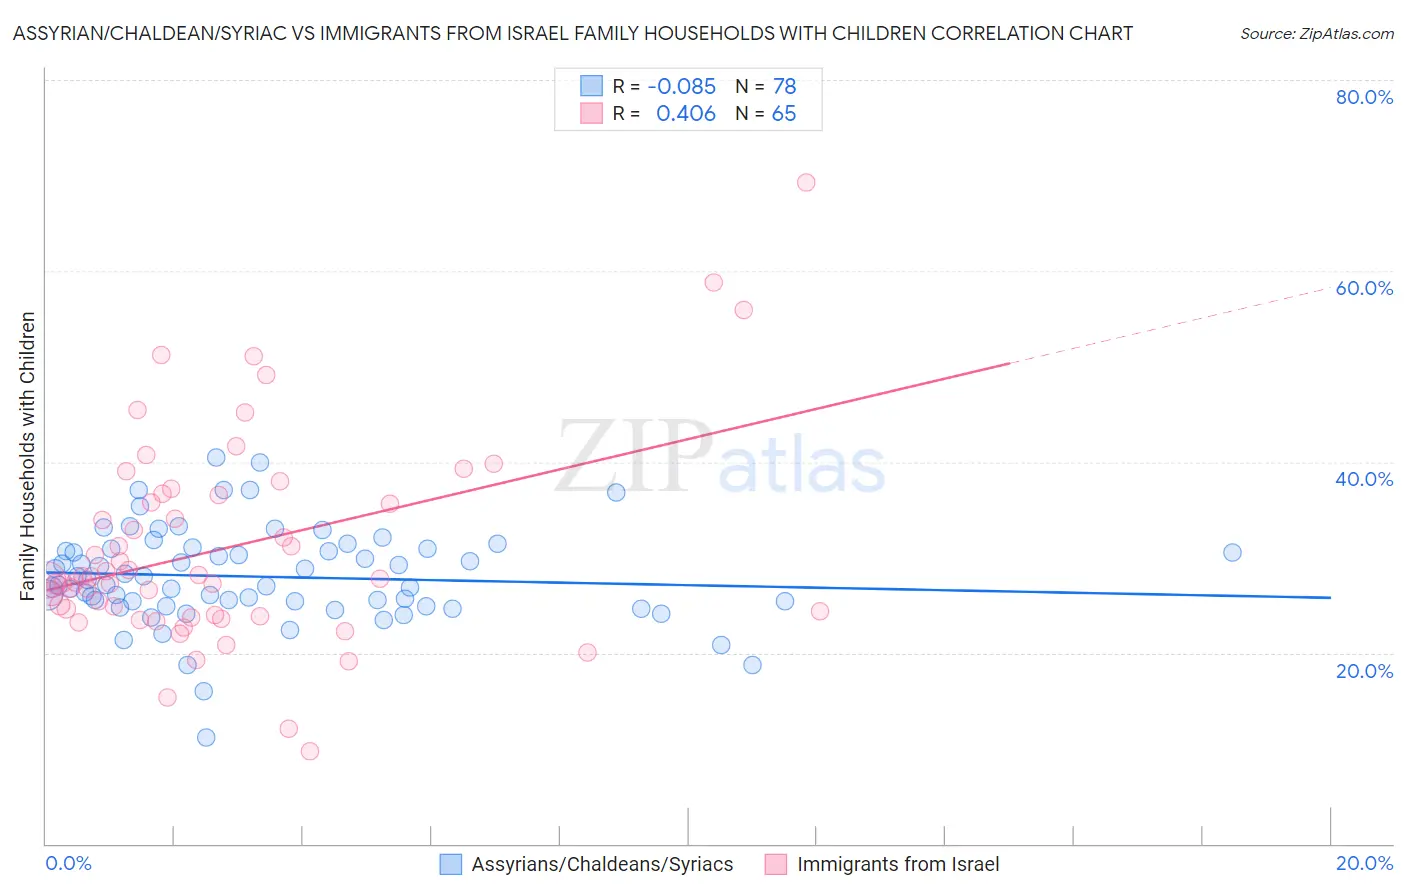
Assyrian/Chaldean/Syriac vs Immigrants from Israel Family Households with Children Correlation Chart
The statistical analysis conducted on geographies consisting of 110,282,118 people shows a slight negative correlation between the proportion of Assyrians/Chaldeans/Syriacs and percentage of family households with children in the United States with a correlation coefficient (R) of -0.085 and weighted average of 28.1%. Similarly, the statistical analysis conducted on geographies consisting of 209,857,521 people shows a moderate positive correlation between the proportion of Immigrants from Israel and percentage of family households with children in the United States with a correlation coefficient (R) of 0.406 and weighted average of 27.4%, a difference of 2.7%.
Family Households with Children Correlation Summary
| Measurement | Assyrian/Chaldean/Syriac | Immigrants from Israel |
| Minimum | 11.1% | 9.6% |
| Maximum | 40.5% | 69.2% |
| Range | 29.4% | 59.6% |
| Mean | 28.0% | 31.0% |
| Median | 27.4% | 27.7% |
| Interquartile 25% (IQ1) | 25.4% | 23.9% |
| Interquartile 75% (IQ3) | 30.8% | 36.6% |
| Interquartile Range (IQR) | 5.4% | 12.7% |
| Standard Deviation (Sample) | 5.0% | 10.9% |
| Standard Deviation (Population) | 5.0% | 10.8% |
Similar Demographics by Family Households with Children
Demographics Similar to Assyrians/Chaldeans/Syriacs by Family Households with Children
In terms of family households with children, the demographic groups most similar to Assyrians/Chaldeans/Syriacs are Immigrants from Oceania (28.1%, a difference of 0.030%), Immigrants from the Azores (28.1%, a difference of 0.050%), Indonesian (28.1%, a difference of 0.050%), Immigrants from Kenya (28.1%, a difference of 0.060%), and Chilean (28.1%, a difference of 0.10%).
| Demographics | Rating | Rank | Family Households with Children |
| Immigrants | Nicaragua | 99.1 /100 | #95 | Exceptional 28.2% |
| Ute | 99.1 /100 | #96 | Exceptional 28.2% |
| Chileans | 98.9 /100 | #97 | Exceptional 28.1% |
| Immigrants | Kenya | 98.9 /100 | #98 | Exceptional 28.1% |
| Immigrants | Azores | 98.8 /100 | #99 | Exceptional 28.1% |
| Indonesians | 98.8 /100 | #100 | Exceptional 28.1% |
| Immigrants | Oceania | 98.8 /100 | #101 | Exceptional 28.1% |
| Assyrians/Chaldeans/Syriacs | 98.7 /100 | #102 | Exceptional 28.1% |
| Palestinians | 98.5 /100 | #103 | Exceptional 28.1% |
| Sioux | 98.3 /100 | #104 | Exceptional 28.1% |
| Choctaw | 98.3 /100 | #105 | Exceptional 28.1% |
| Immigrants | South America | 98.0 /100 | #106 | Exceptional 28.0% |
| Immigrants | Uganda | 97.7 /100 | #107 | Exceptional 28.0% |
| Immigrants | Burma/Myanmar | 97.7 /100 | #108 | Exceptional 28.0% |
| Tohono O'odham | 97.6 /100 | #109 | Exceptional 28.0% |
Demographics Similar to Immigrants from Israel by Family Households with Children
In terms of family households with children, the demographic groups most similar to Immigrants from Israel are Immigrants from Uruguay (27.4%, a difference of 0.010%), Sudanese (27.4%, a difference of 0.010%), Pennsylvania German (27.4%, a difference of 0.010%), Dutch (27.4%, a difference of 0.020%), and Swedish (27.4%, a difference of 0.020%).
| Demographics | Rating | Rank | Family Households with Children |
| Puget Sound Salish | 46.2 /100 | #182 | Average 27.4% |
| South Africans | 44.9 /100 | #183 | Average 27.4% |
| Native Hawaiians | 44.6 /100 | #184 | Average 27.4% |
| Delaware | 42.0 /100 | #185 | Average 27.4% |
| Immigrants | Brazil | 40.6 /100 | #186 | Average 27.4% |
| Creek | 39.8 /100 | #187 | Fair 27.4% |
| Dutch | 38.8 /100 | #188 | Fair 27.4% |
| Immigrants | Israel | 37.9 /100 | #189 | Fair 27.4% |
| Immigrants | Uruguay | 37.7 /100 | #190 | Fair 27.4% |
| Sudanese | 37.6 /100 | #191 | Fair 27.4% |
| Pennsylvania Germans | 37.5 /100 | #192 | Fair 27.4% |
| Swedes | 36.9 /100 | #193 | Fair 27.4% |
| Immigrants | Iran | 36.1 /100 | #194 | Fair 27.4% |
| Crow | 35.7 /100 | #195 | Fair 27.4% |
| Cheyenne | 35.1 /100 | #196 | Fair 27.4% |