Assyrian/Chaldean/Syriac vs Immigrants from Peru Family Households with Children
COMPARE
Assyrian/Chaldean/Syriac
Immigrants from Peru
Family Households with Children
Family Households with Children Comparison
Assyrians/Chaldeans/Syriacs
Immigrants from Peru
28.1%
FAMILY HOUSEHOLDS WITH CHILDREN
98.7/ 100
METRIC RATING
102nd/ 347
METRIC RANK
28.9%
FAMILY HOUSEHOLDS WITH CHILDREN
100.0/ 100
METRIC RATING
51st/ 347
METRIC RANK
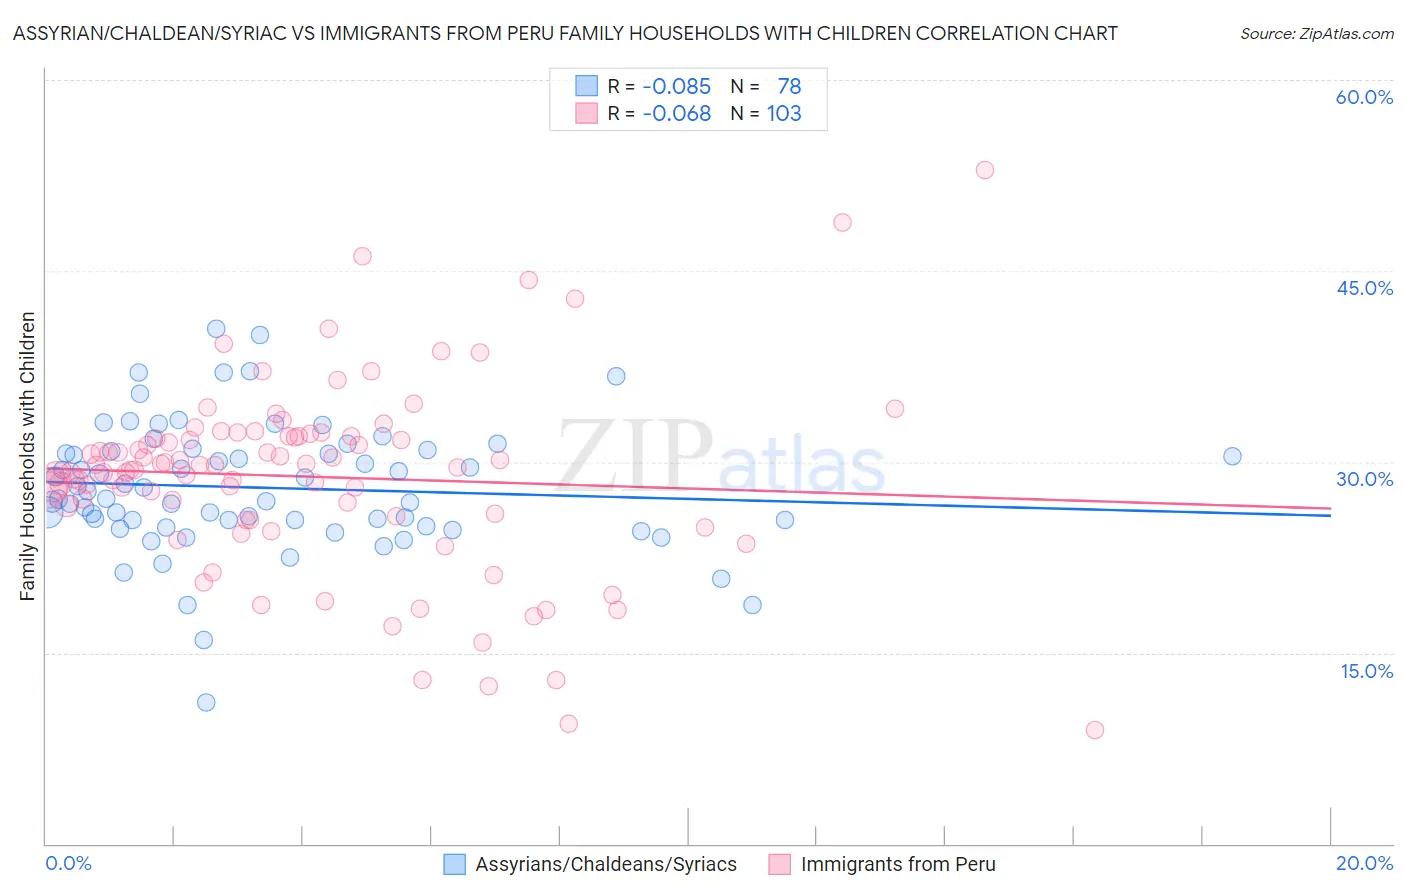
Assyrian/Chaldean/Syriac vs Immigrants from Peru Family Households with Children Correlation Chart
The statistical analysis conducted on geographies consisting of 110,282,118 people shows a slight negative correlation between the proportion of Assyrians/Chaldeans/Syriacs and percentage of family households with children in the United States with a correlation coefficient (R) of -0.085 and weighted average of 28.1%. Similarly, the statistical analysis conducted on geographies consisting of 328,640,714 people shows a slight negative correlation between the proportion of Immigrants from Peru and percentage of family households with children in the United States with a correlation coefficient (R) of -0.068 and weighted average of 28.9%, a difference of 2.9%.
Family Households with Children Correlation Summary
| Measurement | Assyrian/Chaldean/Syriac | Immigrants from Peru |
| Minimum | 11.1% | 9.0% |
| Maximum | 40.5% | 52.9% |
| Range | 29.4% | 44.0% |
| Mean | 28.0% | 28.8% |
| Median | 27.4% | 29.5% |
| Interquartile 25% (IQ1) | 25.4% | 25.8% |
| Interquartile 75% (IQ3) | 30.8% | 32.0% |
| Interquartile Range (IQR) | 5.4% | 6.2% |
| Standard Deviation (Sample) | 5.0% | 7.5% |
| Standard Deviation (Population) | 5.0% | 7.4% |
Similar Demographics by Family Households with Children
Demographics Similar to Assyrians/Chaldeans/Syriacs by Family Households with Children
In terms of family households with children, the demographic groups most similar to Assyrians/Chaldeans/Syriacs are Immigrants from Oceania (28.1%, a difference of 0.030%), Immigrants from the Azores (28.1%, a difference of 0.050%), Indonesian (28.1%, a difference of 0.050%), Immigrants from Kenya (28.1%, a difference of 0.060%), and Chilean (28.1%, a difference of 0.10%).
| Demographics | Rating | Rank | Family Households with Children |
| Immigrants | Nicaragua | 99.1 /100 | #95 | Exceptional 28.2% |
| Ute | 99.1 /100 | #96 | Exceptional 28.2% |
| Chileans | 98.9 /100 | #97 | Exceptional 28.1% |
| Immigrants | Kenya | 98.9 /100 | #98 | Exceptional 28.1% |
| Immigrants | Azores | 98.8 /100 | #99 | Exceptional 28.1% |
| Indonesians | 98.8 /100 | #100 | Exceptional 28.1% |
| Immigrants | Oceania | 98.8 /100 | #101 | Exceptional 28.1% |
| Assyrians/Chaldeans/Syriacs | 98.7 /100 | #102 | Exceptional 28.1% |
| Palestinians | 98.5 /100 | #103 | Exceptional 28.1% |
| Sioux | 98.3 /100 | #104 | Exceptional 28.1% |
| Choctaw | 98.3 /100 | #105 | Exceptional 28.1% |
| Immigrants | South America | 98.0 /100 | #106 | Exceptional 28.0% |
| Immigrants | Uganda | 97.7 /100 | #107 | Exceptional 28.0% |
| Immigrants | Burma/Myanmar | 97.7 /100 | #108 | Exceptional 28.0% |
| Tohono O'odham | 97.6 /100 | #109 | Exceptional 28.0% |
Demographics Similar to Immigrants from Peru by Family Households with Children
In terms of family households with children, the demographic groups most similar to Immigrants from Peru are Immigrants (28.9%, a difference of 0.040%), Guatemalan (28.9%, a difference of 0.080%), Jordanian (29.0%, a difference of 0.14%), Immigrants from Cambodia (28.9%, a difference of 0.15%), and Apache (29.0%, a difference of 0.23%).
| Demographics | Rating | Rank | Family Households with Children |
| Immigrants | Taiwan | 100.0 /100 | #44 | Exceptional 29.0% |
| Fijians | 100.0 /100 | #45 | Exceptional 29.0% |
| Immigrants | Philippines | 100.0 /100 | #46 | Exceptional 29.0% |
| Peruvians | 100.0 /100 | #47 | Exceptional 29.0% |
| Apache | 100.0 /100 | #48 | Exceptional 29.0% |
| Jordanians | 100.0 /100 | #49 | Exceptional 29.0% |
| Immigrants | Immigrants | 100.0 /100 | #50 | Exceptional 28.9% |
| Immigrants | Peru | 100.0 /100 | #51 | Exceptional 28.9% |
| Guatemalans | 100.0 /100 | #52 | Exceptional 28.9% |
| Immigrants | Cambodia | 100.0 /100 | #53 | Exceptional 28.9% |
| Sierra Leoneans | 100.0 /100 | #54 | Exceptional 28.9% |
| Immigrants | Asia | 100.0 /100 | #55 | Exceptional 28.8% |
| Immigrants | Guatemala | 100.0 /100 | #56 | Exceptional 28.8% |
| Danes | 100.0 /100 | #57 | Exceptional 28.7% |
| Hawaiians | 100.0 /100 | #58 | Exceptional 28.7% |