Assyrian/Chaldean/Syriac vs Immigrants from Panama Family Households with Children
COMPARE
Assyrian/Chaldean/Syriac
Immigrants from Panama
Family Households with Children
Family Households with Children Comparison
Assyrians/Chaldeans/Syriacs
Immigrants from Panama
28.1%
FAMILY HOUSEHOLDS WITH CHILDREN
98.7/ 100
METRIC RATING
102nd/ 347
METRIC RANK
27.7%
FAMILY HOUSEHOLDS WITH CHILDREN
84.9/ 100
METRIC RATING
134th/ 347
METRIC RANK
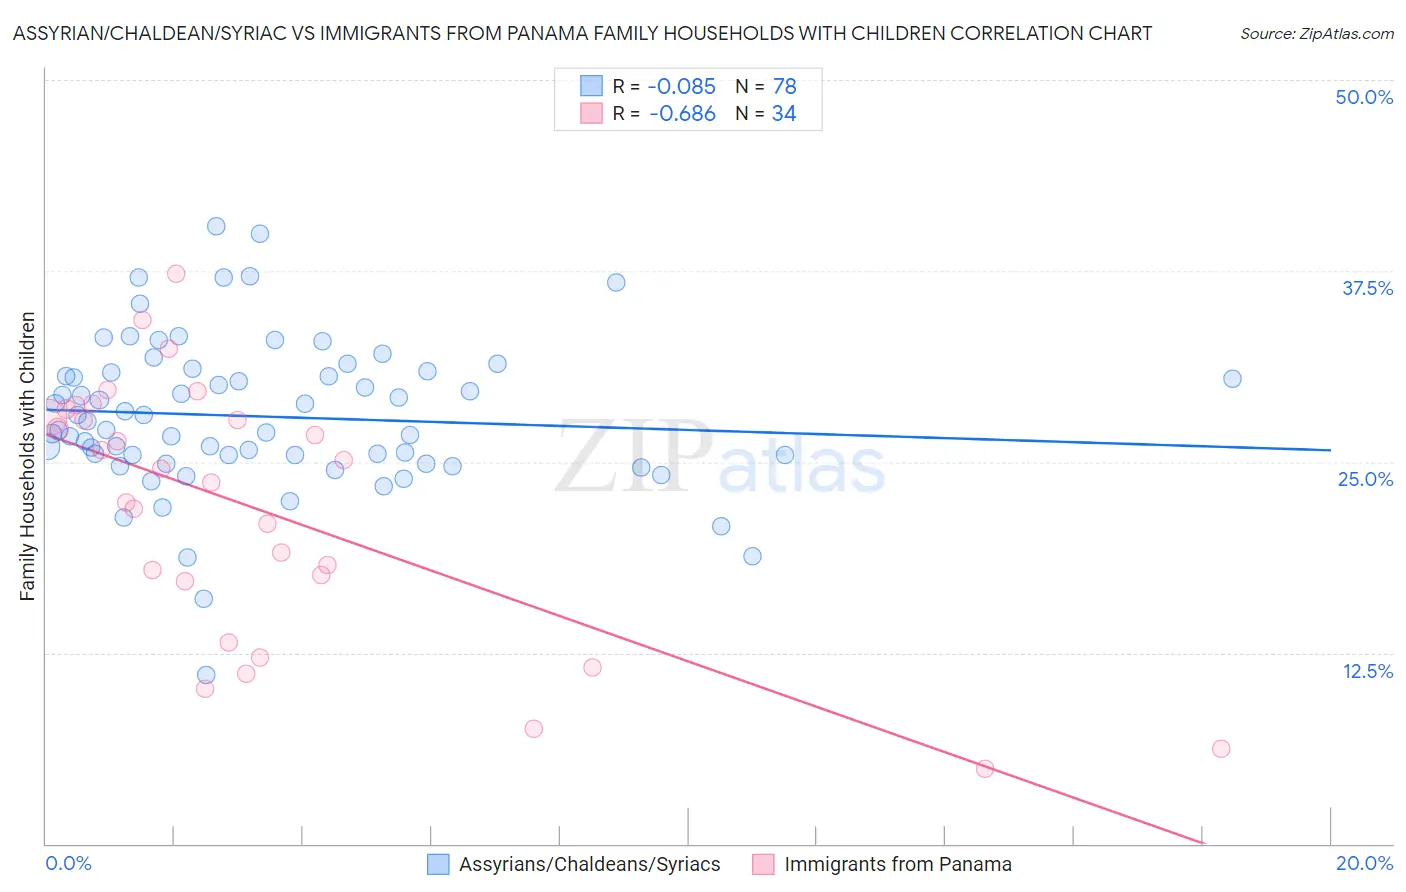
Assyrian/Chaldean/Syriac vs Immigrants from Panama Family Households with Children Correlation Chart
The statistical analysis conducted on geographies consisting of 110,282,118 people shows a slight negative correlation between the proportion of Assyrians/Chaldeans/Syriacs and percentage of family households with children in the United States with a correlation coefficient (R) of -0.085 and weighted average of 28.1%. Similarly, the statistical analysis conducted on geographies consisting of 221,156,248 people shows a significant negative correlation between the proportion of Immigrants from Panama and percentage of family households with children in the United States with a correlation coefficient (R) of -0.686 and weighted average of 27.7%, a difference of 1.4%.
Family Households with Children Correlation Summary
| Measurement | Assyrian/Chaldean/Syriac | Immigrants from Panama |
| Minimum | 11.1% | 4.9% |
| Maximum | 40.5% | 37.4% |
| Range | 29.4% | 32.4% |
| Mean | 28.0% | 21.9% |
| Median | 27.4% | 24.1% |
| Interquartile 25% (IQ1) | 25.4% | 17.2% |
| Interquartile 75% (IQ3) | 30.8% | 27.9% |
| Interquartile Range (IQR) | 5.4% | 10.6% |
| Standard Deviation (Sample) | 5.0% | 8.4% |
| Standard Deviation (Population) | 5.0% | 8.3% |
Similar Demographics by Family Households with Children
Demographics Similar to Assyrians/Chaldeans/Syriacs by Family Households with Children
In terms of family households with children, the demographic groups most similar to Assyrians/Chaldeans/Syriacs are Immigrants from Oceania (28.1%, a difference of 0.030%), Immigrants from the Azores (28.1%, a difference of 0.050%), Indonesian (28.1%, a difference of 0.050%), Immigrants from Kenya (28.1%, a difference of 0.060%), and Chilean (28.1%, a difference of 0.10%).
| Demographics | Rating | Rank | Family Households with Children |
| Immigrants | Nicaragua | 99.1 /100 | #95 | Exceptional 28.2% |
| Ute | 99.1 /100 | #96 | Exceptional 28.2% |
| Chileans | 98.9 /100 | #97 | Exceptional 28.1% |
| Immigrants | Kenya | 98.9 /100 | #98 | Exceptional 28.1% |
| Immigrants | Azores | 98.8 /100 | #99 | Exceptional 28.1% |
| Indonesians | 98.8 /100 | #100 | Exceptional 28.1% |
| Immigrants | Oceania | 98.8 /100 | #101 | Exceptional 28.1% |
| Assyrians/Chaldeans/Syriacs | 98.7 /100 | #102 | Exceptional 28.1% |
| Palestinians | 98.5 /100 | #103 | Exceptional 28.1% |
| Sioux | 98.3 /100 | #104 | Exceptional 28.1% |
| Choctaw | 98.3 /100 | #105 | Exceptional 28.1% |
| Immigrants | South America | 98.0 /100 | #106 | Exceptional 28.0% |
| Immigrants | Uganda | 97.7 /100 | #107 | Exceptional 28.0% |
| Immigrants | Burma/Myanmar | 97.7 /100 | #108 | Exceptional 28.0% |
| Tohono O'odham | 97.6 /100 | #109 | Exceptional 28.0% |
Demographics Similar to Immigrants from Panama by Family Households with Children
In terms of family households with children, the demographic groups most similar to Immigrants from Panama are Iranian (27.7%, a difference of 0.010%), Immigrants from Ecuador (27.7%, a difference of 0.010%), Immigrants from Portugal (27.7%, a difference of 0.030%), Immigrants from Belize (27.7%, a difference of 0.040%), and Immigrants from Dominican Republic (27.7%, a difference of 0.040%).
| Demographics | Rating | Rank | Family Households with Children |
| Belizeans | 90.0 /100 | #127 | Exceptional 27.8% |
| Syrians | 89.7 /100 | #128 | Excellent 27.8% |
| Immigrants | Eritrea | 89.4 /100 | #129 | Excellent 27.8% |
| Cajuns | 87.6 /100 | #130 | Excellent 27.7% |
| Lebanese | 87.4 /100 | #131 | Excellent 27.7% |
| Immigrants | Belize | 85.7 /100 | #132 | Excellent 27.7% |
| Iranians | 85.2 /100 | #133 | Excellent 27.7% |
| Immigrants | Panama | 84.9 /100 | #134 | Excellent 27.7% |
| Immigrants | Ecuador | 84.6 /100 | #135 | Excellent 27.7% |
| Immigrants | Portugal | 84.1 /100 | #136 | Excellent 27.7% |
| Immigrants | Dominican Republic | 83.9 /100 | #137 | Excellent 27.7% |
| Uruguayans | 83.2 /100 | #138 | Excellent 27.7% |
| Vietnamese | 82.6 /100 | #139 | Excellent 27.7% |
| Spanish | 81.8 /100 | #140 | Excellent 27.7% |
| Immigrants | Eastern Asia | 81.7 /100 | #141 | Excellent 27.7% |