Immigrants from Uzbekistan vs Croatian Single Father Households
COMPARE
Immigrants from Uzbekistan
Croatian
Single Father Households
Single Father Households Comparison
Immigrants from Uzbekistan
Croatians
1.8%
SINGLE FATHER HOUSEHOLDS
100.0/ 100
METRIC RATING
4th/ 347
METRIC RANK
2.1%
SINGLE FATHER HOUSEHOLDS
99.3/ 100
METRIC RATING
93rd/ 347
METRIC RANK
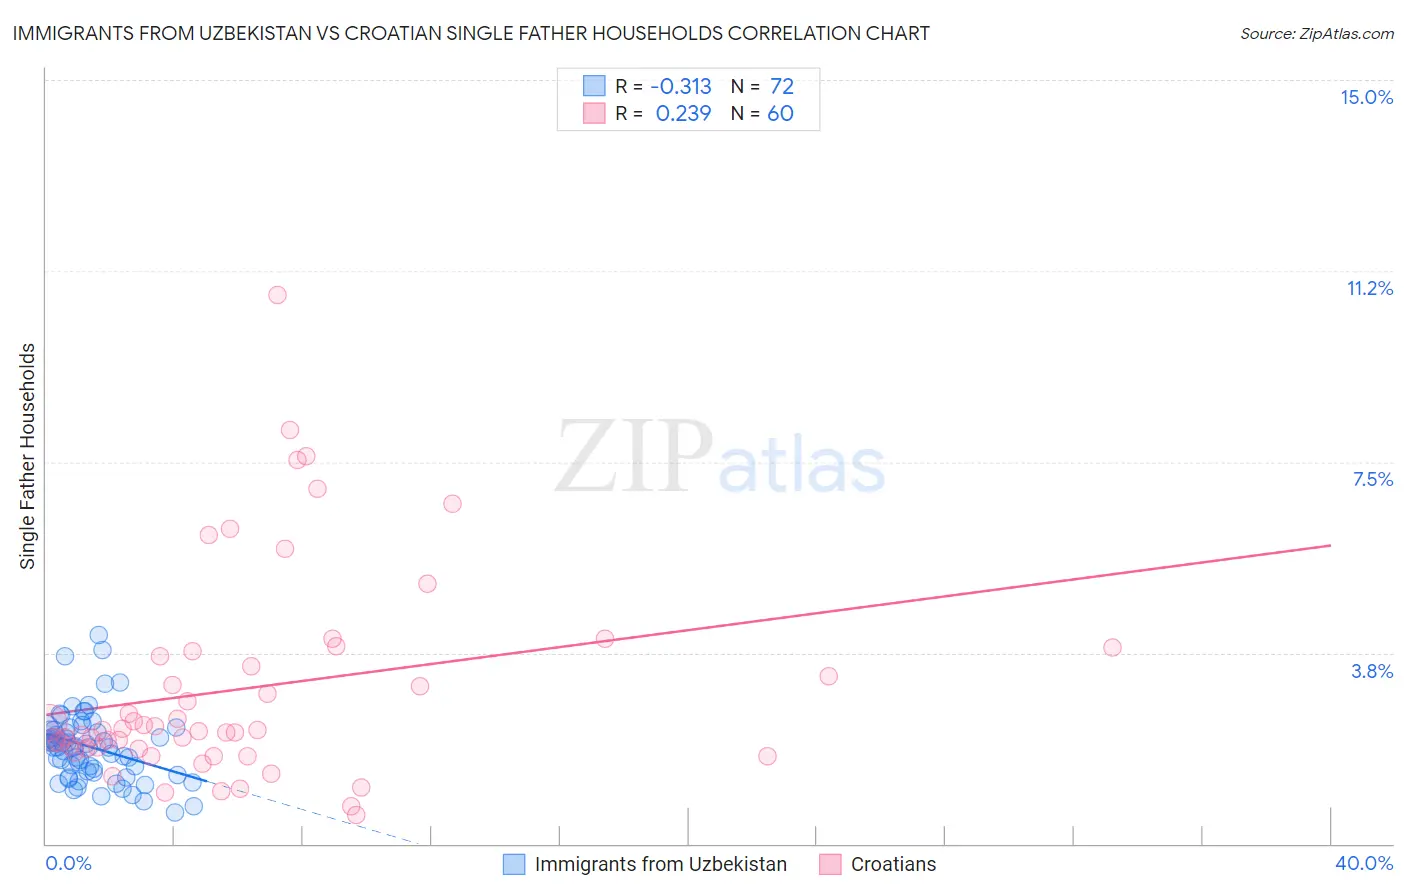
Immigrants from Uzbekistan vs Croatian Single Father Households Correlation Chart
The statistical analysis conducted on geographies consisting of 118,416,914 people shows a mild negative correlation between the proportion of Immigrants from Uzbekistan and percentage of single father households in the United States with a correlation coefficient (R) of -0.313 and weighted average of 1.8%. Similarly, the statistical analysis conducted on geographies consisting of 372,052,668 people shows a weak positive correlation between the proportion of Croatians and percentage of single father households in the United States with a correlation coefficient (R) of 0.239 and weighted average of 2.1%, a difference of 17.0%.
Single Father Households Correlation Summary
| Measurement | Immigrants from Uzbekistan | Croatian |
| Minimum | 0.62% | 0.56% |
| Maximum | 4.1% | 10.8% |
| Range | 3.5% | 10.2% |
| Mean | 1.9% | 3.1% |
| Median | 1.9% | 2.2% |
| Interquartile 25% (IQ1) | 1.4% | 1.9% |
| Interquartile 75% (IQ3) | 2.2% | 3.7% |
| Interquartile Range (IQR) | 0.82% | 1.9% |
| Standard Deviation (Sample) | 0.68% | 2.1% |
| Standard Deviation (Population) | 0.68% | 2.1% |
Similar Demographics by Single Father Households
Demographics Similar to Immigrants from Uzbekistan by Single Father Households
In terms of single father households, the demographic groups most similar to Immigrants from Uzbekistan are Filipino (1.8%, a difference of 0.66%), Immigrants from Hong Kong (1.8%, a difference of 0.94%), Immigrants from Israel (1.8%, a difference of 1.1%), Soviet Union (1.8%, a difference of 1.1%), and Immigrants from Taiwan (1.8%, a difference of 1.3%).
| Demographics | Rating | Rank | Single Father Households |
| Soviet Union | 100.0 /100 | #1 | Exceptional 1.8% |
| Immigrants | Israel | 100.0 /100 | #2 | Exceptional 1.8% |
| Filipinos | 100.0 /100 | #3 | Exceptional 1.8% |
| Immigrants | Uzbekistan | 100.0 /100 | #4 | Exceptional 1.8% |
| Immigrants | Hong Kong | 100.0 /100 | #5 | Exceptional 1.8% |
| Immigrants | Taiwan | 100.0 /100 | #6 | Exceptional 1.8% |
| Cypriots | 100.0 /100 | #7 | Exceptional 1.8% |
| Immigrants | Ireland | 100.0 /100 | #8 | Exceptional 1.8% |
| Immigrants | China | 100.0 /100 | #9 | Exceptional 1.8% |
| Okinawans | 100.0 /100 | #10 | Exceptional 1.9% |
| Immigrants | Belarus | 100.0 /100 | #11 | Exceptional 1.9% |
| Immigrants | Greece | 100.0 /100 | #12 | Exceptional 1.9% |
| Immigrants | Singapore | 100.0 /100 | #13 | Exceptional 1.9% |
| Immigrants | Lithuania | 100.0 /100 | #14 | Exceptional 1.9% |
| Immigrants | Eastern Asia | 100.0 /100 | #15 | Exceptional 1.9% |
Demographics Similar to Croatians by Single Father Households
In terms of single father households, the demographic groups most similar to Croatians are Ukrainian (2.1%, a difference of 0.0%), Romanian (2.1%, a difference of 0.11%), Immigrants from Guyana (2.1%, a difference of 0.20%), Bermudan (2.1%, a difference of 0.23%), and Arab (2.1%, a difference of 0.37%).
| Demographics | Rating | Rank | Single Father Households |
| Asians | 99.6 /100 | #86 | Exceptional 2.1% |
| Lithuanians | 99.5 /100 | #87 | Exceptional 2.1% |
| Bhutanese | 99.5 /100 | #88 | Exceptional 2.1% |
| Immigrants | Armenia | 99.5 /100 | #89 | Exceptional 2.1% |
| Immigrants | Pakistan | 99.5 /100 | #90 | Exceptional 2.1% |
| Immigrants | Guyana | 99.4 /100 | #91 | Exceptional 2.1% |
| Romanians | 99.4 /100 | #92 | Exceptional 2.1% |
| Croatians | 99.3 /100 | #93 | Exceptional 2.1% |
| Ukrainians | 99.3 /100 | #94 | Exceptional 2.1% |
| Bermudans | 99.2 /100 | #95 | Exceptional 2.1% |
| Arabs | 99.2 /100 | #96 | Exceptional 2.1% |
| Immigrants | Moldova | 99.1 /100 | #97 | Exceptional 2.1% |
| Guyanese | 99.1 /100 | #98 | Exceptional 2.1% |
| South Africans | 99.1 /100 | #99 | Exceptional 2.1% |
| Immigrants | Northern Africa | 99.0 /100 | #100 | Exceptional 2.1% |