Asian vs Turkish 3rd Grade
COMPARE
Asian
Turkish
3rd Grade
3rd Grade Comparison
Asians
Turks
97.4%
3RD GRADE
1.1/ 100
METRIC RATING
244th/ 347
METRIC RANK
98.1%
3RD GRADE
97.6/ 100
METRIC RATING
104th/ 347
METRIC RANK
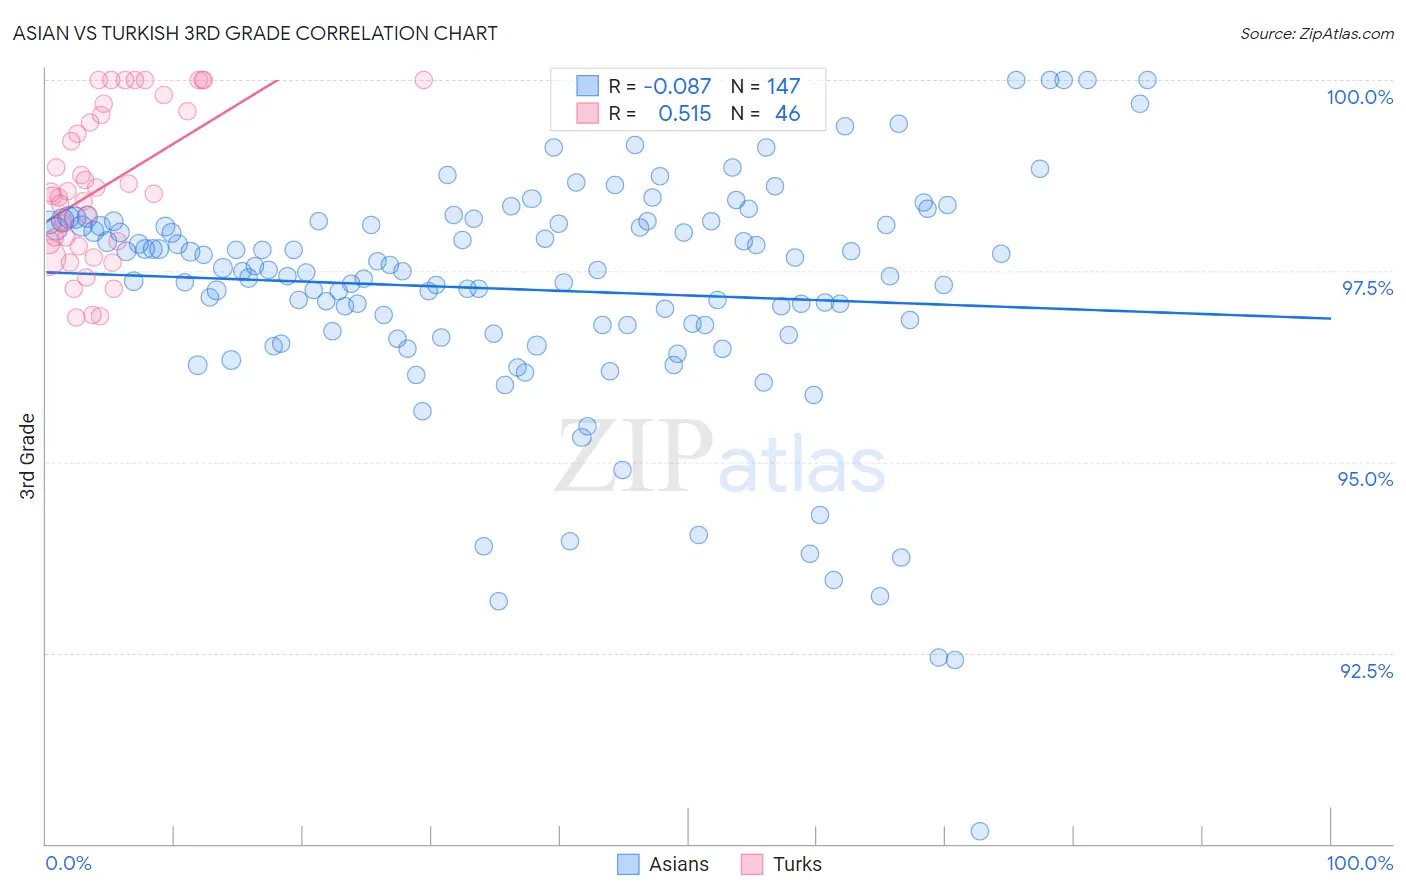
Asian vs Turkish 3rd Grade Correlation Chart
The statistical analysis conducted on geographies consisting of 550,801,467 people shows a slight negative correlation between the proportion of Asians and percentage of population with at least 3rd grade education in the United States with a correlation coefficient (R) of -0.087 and weighted average of 97.4%. Similarly, the statistical analysis conducted on geographies consisting of 271,858,657 people shows a substantial positive correlation between the proportion of Turks and percentage of population with at least 3rd grade education in the United States with a correlation coefficient (R) of 0.515 and weighted average of 98.1%, a difference of 0.69%.
3rd Grade Correlation Summary
| Measurement | Asian | Turkish |
| Minimum | 90.2% | 96.9% |
| Maximum | 100.0% | 100.0% |
| Range | 9.8% | 3.1% |
| Mean | 97.3% | 98.6% |
| Median | 97.5% | 98.5% |
| Interquartile 25% (IQ1) | 96.7% | 97.9% |
| Interquartile 75% (IQ3) | 98.1% | 99.6% |
| Interquartile Range (IQR) | 1.4% | 1.7% |
| Standard Deviation (Sample) | 1.6% | 0.99% |
| Standard Deviation (Population) | 1.6% | 0.98% |
Similar Demographics by 3rd Grade
Demographics Similar to Asians by 3rd Grade
In terms of 3rd grade, the demographic groups most similar to Asians are Ethiopian (97.4%, a difference of 0.0%), Korean (97.4%, a difference of 0.010%), Indian (Asian) (97.4%, a difference of 0.010%), Immigrants from Senegal (97.4%, a difference of 0.010%), and Assyrian/Chaldean/Syriac (97.4%, a difference of 0.010%).
| Demographics | Rating | Rank | 3rd Grade |
| Colombians | 1.8 /100 | #237 | Tragic 97.4% |
| Immigrants | Uruguay | 1.7 /100 | #238 | Tragic 97.4% |
| Nigerians | 1.6 /100 | #239 | Tragic 97.4% |
| U.S. Virgin Islanders | 1.4 /100 | #240 | Tragic 97.4% |
| Immigrants | Indonesia | 1.4 /100 | #241 | Tragic 97.4% |
| Koreans | 1.3 /100 | #242 | Tragic 97.4% |
| Indians (Asian) | 1.3 /100 | #243 | Tragic 97.4% |
| Asians | 1.1 /100 | #244 | Tragic 97.4% |
| Ethiopians | 1.1 /100 | #245 | Tragic 97.4% |
| Immigrants | Senegal | 1.0 /100 | #246 | Tragic 97.4% |
| Assyrians/Chaldeans/Syriacs | 1.0 /100 | #247 | Tragic 97.4% |
| Immigrants | Eastern Africa | 0.9 /100 | #248 | Tragic 97.4% |
| South Americans | 0.9 /100 | #249 | Tragic 97.4% |
| Immigrants | Middle Africa | 0.9 /100 | #250 | Tragic 97.4% |
| Immigrants | Asia | 0.8 /100 | #251 | Tragic 97.4% |
Demographics Similar to Turks by 3rd Grade
In terms of 3rd grade, the demographic groups most similar to Turks are Yugoslavian (98.1%, a difference of 0.0%), Romanian (98.1%, a difference of 0.010%), Cree (98.1%, a difference of 0.010%), Puget Sound Salish (98.1%, a difference of 0.010%), and Nonimmigrants (98.1%, a difference of 0.010%).
| Demographics | Rating | Rank | 3rd Grade |
| South Africans | 98.2 /100 | #97 | Exceptional 98.1% |
| Choctaw | 98.0 /100 | #98 | Exceptional 98.1% |
| Romanians | 98.0 /100 | #99 | Exceptional 98.1% |
| Cree | 97.9 /100 | #100 | Exceptional 98.1% |
| Puget Sound Salish | 97.9 /100 | #101 | Exceptional 98.1% |
| Immigrants | Nonimmigrants | 97.8 /100 | #102 | Exceptional 98.1% |
| Yugoslavians | 97.7 /100 | #103 | Exceptional 98.1% |
| Turks | 97.6 /100 | #104 | Exceptional 98.1% |
| German Russians | 97.2 /100 | #105 | Exceptional 98.1% |
| Bhutanese | 97.2 /100 | #106 | Exceptional 98.1% |
| Immigrants | Czechoslovakia | 97.0 /100 | #107 | Exceptional 98.0% |
| Immigrants | Singapore | 96.7 /100 | #108 | Exceptional 98.0% |
| Pima | 96.7 /100 | #109 | Exceptional 98.0% |
| Immigrants | Switzerland | 96.6 /100 | #110 | Exceptional 98.0% |
| Basques | 96.5 /100 | #111 | Exceptional 98.0% |