Argentinean vs Immigrants from Venezuela Single Mother Households
COMPARE
Argentinean
Immigrants from Venezuela
Single Mother Households
Single Mother Households Comparison
Argentineans
Immigrants from Venezuela
5.8%
SINGLE MOTHER HOUSEHOLDS
93.7/ 100
METRIC RATING
121st/ 347
METRIC RANK
6.7%
SINGLE MOTHER HOUSEHOLDS
8.5/ 100
METRIC RATING
211th/ 347
METRIC RANK
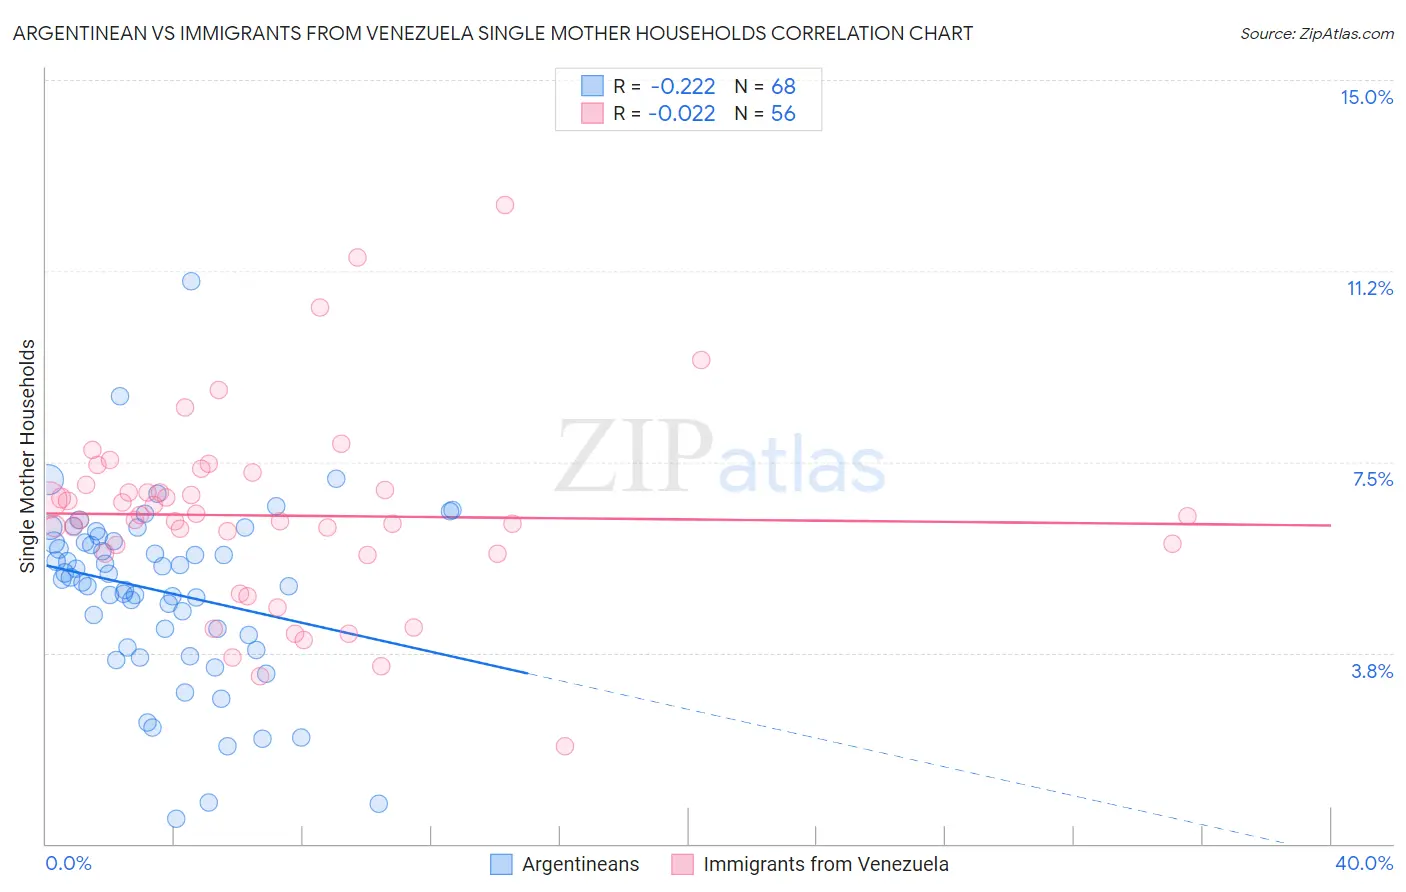
Argentinean vs Immigrants from Venezuela Single Mother Households Correlation Chart
The statistical analysis conducted on geographies consisting of 296,614,684 people shows a weak negative correlation between the proportion of Argentineans and percentage of single mother households in the United States with a correlation coefficient (R) of -0.222 and weighted average of 5.8%. Similarly, the statistical analysis conducted on geographies consisting of 287,554,408 people shows no correlation between the proportion of Immigrants from Venezuela and percentage of single mother households in the United States with a correlation coefficient (R) of -0.022 and weighted average of 6.7%, a difference of 15.0%.
Single Mother Households Correlation Summary
| Measurement | Argentinean | Immigrants from Venezuela |
| Minimum | 0.49% | 1.9% |
| Maximum | 11.1% | 12.6% |
| Range | 10.6% | 10.6% |
| Mean | 5.0% | 6.4% |
| Median | 5.2% | 6.4% |
| Interquartile 25% (IQ1) | 4.0% | 5.7% |
| Interquartile 75% (IQ3) | 5.9% | 7.0% |
| Interquartile Range (IQR) | 1.9% | 1.3% |
| Standard Deviation (Sample) | 1.8% | 1.9% |
| Standard Deviation (Population) | 1.8% | 1.9% |
Similar Demographics by Single Mother Households
Demographics Similar to Argentineans by Single Mother Households
In terms of single mother households, the demographic groups most similar to Argentineans are Tongan (5.8%, a difference of 0.020%), Belgian (5.8%, a difference of 0.080%), Immigrants from Uzbekistan (5.9%, a difference of 0.14%), Immigrants from Argentina (5.9%, a difference of 0.21%), and South African (5.8%, a difference of 0.22%).
| Demographics | Rating | Rank | Single Mother Households |
| Dutch | 95.1 /100 | #114 | Exceptional 5.8% |
| Irish | 94.8 /100 | #115 | Exceptional 5.8% |
| Pennsylvania Germans | 94.7 /100 | #116 | Exceptional 5.8% |
| Bolivians | 94.6 /100 | #117 | Exceptional 5.8% |
| Laotians | 94.3 /100 | #118 | Exceptional 5.8% |
| South Africans | 94.1 /100 | #119 | Exceptional 5.8% |
| Tongans | 93.7 /100 | #120 | Exceptional 5.8% |
| Argentineans | 93.7 /100 | #121 | Exceptional 5.8% |
| Belgians | 93.5 /100 | #122 | Exceptional 5.8% |
| Immigrants | Uzbekistan | 93.4 /100 | #123 | Exceptional 5.9% |
| Immigrants | Argentina | 93.2 /100 | #124 | Exceptional 5.9% |
| Slavs | 92.9 /100 | #125 | Exceptional 5.9% |
| Welsh | 92.8 /100 | #126 | Exceptional 5.9% |
| Lebanese | 92.4 /100 | #127 | Exceptional 5.9% |
| Czechoslovakians | 92.2 /100 | #128 | Exceptional 5.9% |
Demographics Similar to Immigrants from Venezuela by Single Mother Households
In terms of single mother households, the demographic groups most similar to Immigrants from Venezuela are Immigrants from Eritrea (6.7%, a difference of 0.050%), Immigrants from Costa Rica (6.7%, a difference of 0.11%), Immigrants from Uruguay (6.7%, a difference of 0.22%), Nonimmigrants (6.7%, a difference of 0.58%), and Immigrants from Colombia (6.7%, a difference of 0.60%).
| Demographics | Rating | Rank | Single Mother Households |
| Immigrants | Fiji | 11.9 /100 | #204 | Poor 6.7% |
| Cree | 11.9 /100 | #205 | Poor 6.7% |
| German Russians | 11.5 /100 | #206 | Poor 6.7% |
| Immigrants | South America | 11.5 /100 | #207 | Poor 6.7% |
| Vietnamese | 11.3 /100 | #208 | Poor 6.7% |
| Immigrants | Colombia | 10.5 /100 | #209 | Poor 6.7% |
| Immigrants | Nonimmigrants | 10.4 /100 | #210 | Poor 6.7% |
| Immigrants | Venezuela | 8.5 /100 | #211 | Tragic 6.7% |
| Immigrants | Eritrea | 8.4 /100 | #212 | Tragic 6.7% |
| Immigrants | Costa Rica | 8.2 /100 | #213 | Tragic 6.7% |
| Immigrants | Uruguay | 7.9 /100 | #214 | Tragic 6.7% |
| Shoshone | 5.7 /100 | #215 | Tragic 6.8% |
| Cherokee | 5.1 /100 | #216 | Tragic 6.8% |
| Aleuts | 4.8 /100 | #217 | Tragic 6.8% |
| Immigrants | Eastern Africa | 4.4 /100 | #218 | Tragic 6.8% |