Immigrants from England vs African Average Family Size
COMPARE
Immigrants from England
African
Average Family Size
Average Family Size Comparison
Immigrants from England
Africans
3.15
AVERAGE FAMILY SIZE
0.4/ 100
METRIC RATING
280th/ 347
METRIC RANK
3.25
AVERAGE FAMILY SIZE
84.9/ 100
METRIC RATING
134th/ 347
METRIC RANK
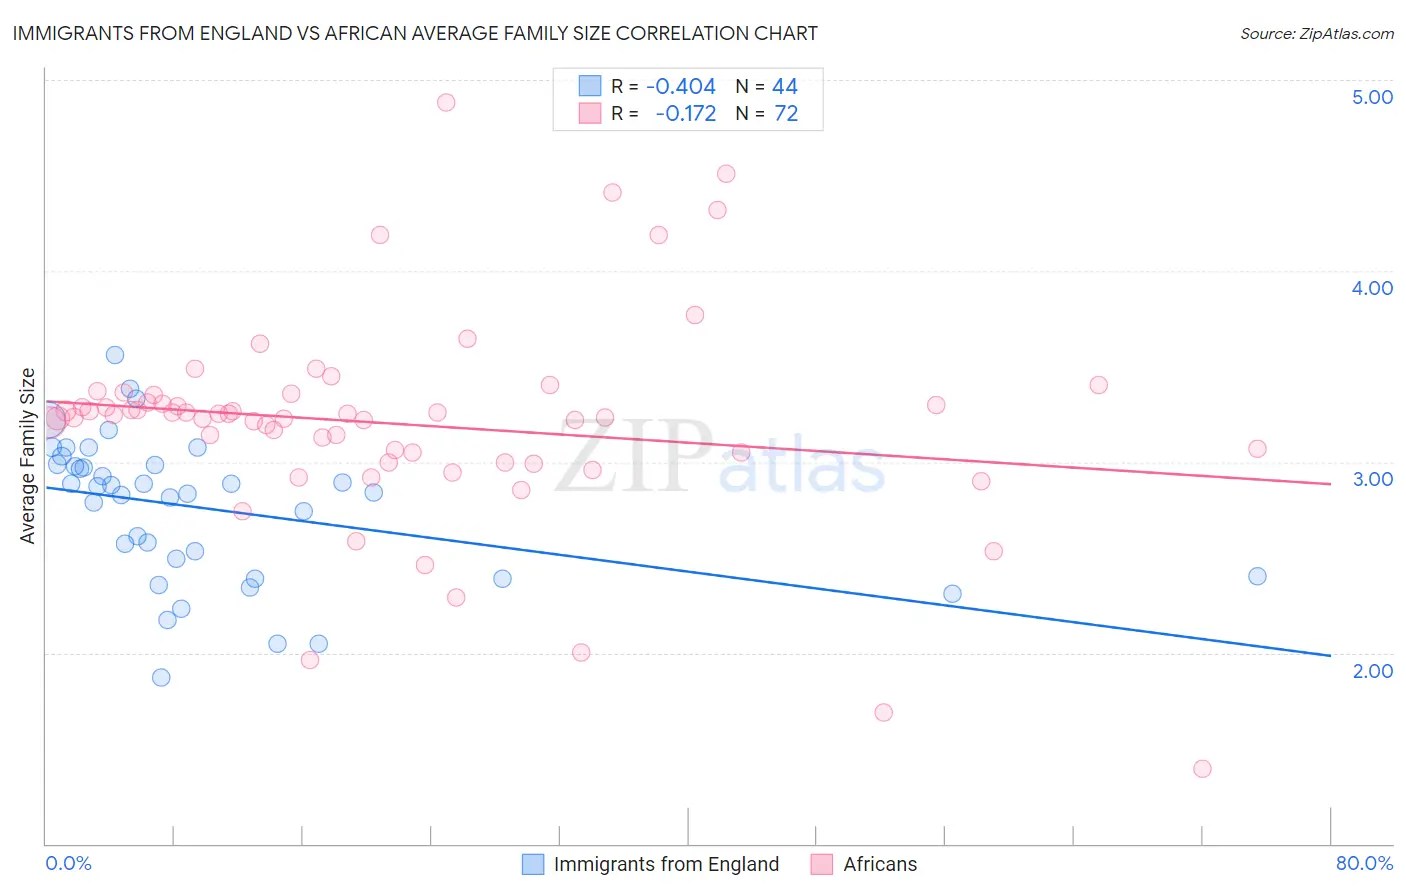
Immigrants from England vs African Average Family Size Correlation Chart
The statistical analysis conducted on geographies consisting of 391,752,493 people shows a moderate negative correlation between the proportion of Immigrants from England and average family size in the United States with a correlation coefficient (R) of -0.404 and weighted average of 3.15. Similarly, the statistical analysis conducted on geographies consisting of 469,598,302 people shows a poor negative correlation between the proportion of Africans and average family size in the United States with a correlation coefficient (R) of -0.172 and weighted average of 3.25, a difference of 3.4%.
Average Family Size Correlation Summary
| Measurement | Immigrants from England | African |
| Minimum | 1.87 | 1.39 |
| Maximum | 3.56 | 4.88 |
| Range | 1.69 | 3.49 |
| Mean | 2.76 | 3.20 |
| Median | 2.86 | 3.24 |
| Interquartile 25% (IQ1) | 2.45 | 3.02 |
| Interquartile 75% (IQ3) | 2.99 | 3.33 |
| Interquartile Range (IQR) | 0.54 | 0.31 |
| Standard Deviation (Sample) | 0.38 | 0.56 |
| Standard Deviation (Population) | 0.37 | 0.55 |
Similar Demographics by Average Family Size
Demographics Similar to Immigrants from England by Average Family Size
In terms of average family size, the demographic groups most similar to Immigrants from England are Immigrants from Europe (3.15, a difference of 0.030%), Okinawan (3.15, a difference of 0.040%), Immigrants from Denmark (3.15, a difference of 0.040%), Yugoslavian (3.15, a difference of 0.040%), and German Russian (3.15, a difference of 0.060%).
| Demographics | Rating | Rank | Average Family Size |
| New Zealanders | 0.6 /100 | #273 | Tragic 3.15 |
| Immigrants | Belgium | 0.6 /100 | #274 | Tragic 3.15 |
| Cambodians | 0.6 /100 | #275 | Tragic 3.15 |
| Immigrants | Bosnia and Herzegovina | 0.5 /100 | #276 | Tragic 3.15 |
| Swiss | 0.5 /100 | #277 | Tragic 3.15 |
| Okinawans | 0.5 /100 | #278 | Tragic 3.15 |
| Immigrants | Europe | 0.5 /100 | #279 | Tragic 3.15 |
| Immigrants | England | 0.4 /100 | #280 | Tragic 3.15 |
| Immigrants | Denmark | 0.4 /100 | #281 | Tragic 3.15 |
| Yugoslavians | 0.4 /100 | #282 | Tragic 3.15 |
| German Russians | 0.4 /100 | #283 | Tragic 3.15 |
| Immigrants | France | 0.4 /100 | #284 | Tragic 3.15 |
| Whites/Caucasians | 0.3 /100 | #285 | Tragic 3.14 |
| Immigrants | Netherlands | 0.3 /100 | #286 | Tragic 3.14 |
| Greeks | 0.3 /100 | #287 | Tragic 3.14 |
Demographics Similar to Africans by Average Family Size
In terms of average family size, the demographic groups most similar to Africans are Panamanian (3.25, a difference of 0.020%), Immigrants from Venezuela (3.26, a difference of 0.050%), Costa Rican (3.26, a difference of 0.070%), Comanche (3.25, a difference of 0.070%), and Immigrants from Middle Africa (3.25, a difference of 0.080%).
| Demographics | Rating | Rank | Average Family Size |
| Immigrants | Syria | 90.6 /100 | #127 | Exceptional 3.26 |
| Colombians | 89.9 /100 | #128 | Excellent 3.26 |
| Immigrants | Hong Kong | 88.6 /100 | #129 | Excellent 3.26 |
| Laotians | 88.5 /100 | #130 | Excellent 3.26 |
| Immigrants | Western Asia | 87.7 /100 | #131 | Excellent 3.26 |
| Costa Ricans | 86.8 /100 | #132 | Excellent 3.26 |
| Immigrants | Venezuela | 86.3 /100 | #133 | Excellent 3.26 |
| Africans | 84.9 /100 | #134 | Excellent 3.25 |
| Panamanians | 84.2 /100 | #135 | Excellent 3.25 |
| Comanche | 82.8 /100 | #136 | Excellent 3.25 |
| Immigrants | Middle Africa | 82.4 /100 | #137 | Excellent 3.25 |
| Cubans | 81.8 /100 | #138 | Excellent 3.25 |
| Immigrants | Ethiopia | 81.6 /100 | #139 | Excellent 3.25 |
| Sub-Saharan Africans | 81.6 /100 | #140 | Excellent 3.25 |
| Venezuelans | 81.4 /100 | #141 | Excellent 3.25 |