Immigrants from Vietnam vs Sierra Leonean Births to Unmarried Women
COMPARE
Immigrants from Vietnam
Sierra Leonean
Births to Unmarried Women
Births to Unmarried Women Comparison
Immigrants from Vietnam
Sierra Leoneans
29.3%
BIRTHS TO UNMARRIED WOMEN
96.1/ 100
METRIC RATING
95th/ 347
METRIC RANK
34.9%
BIRTHS TO UNMARRIED WOMEN
1.4/ 100
METRIC RATING
239th/ 347
METRIC RANK
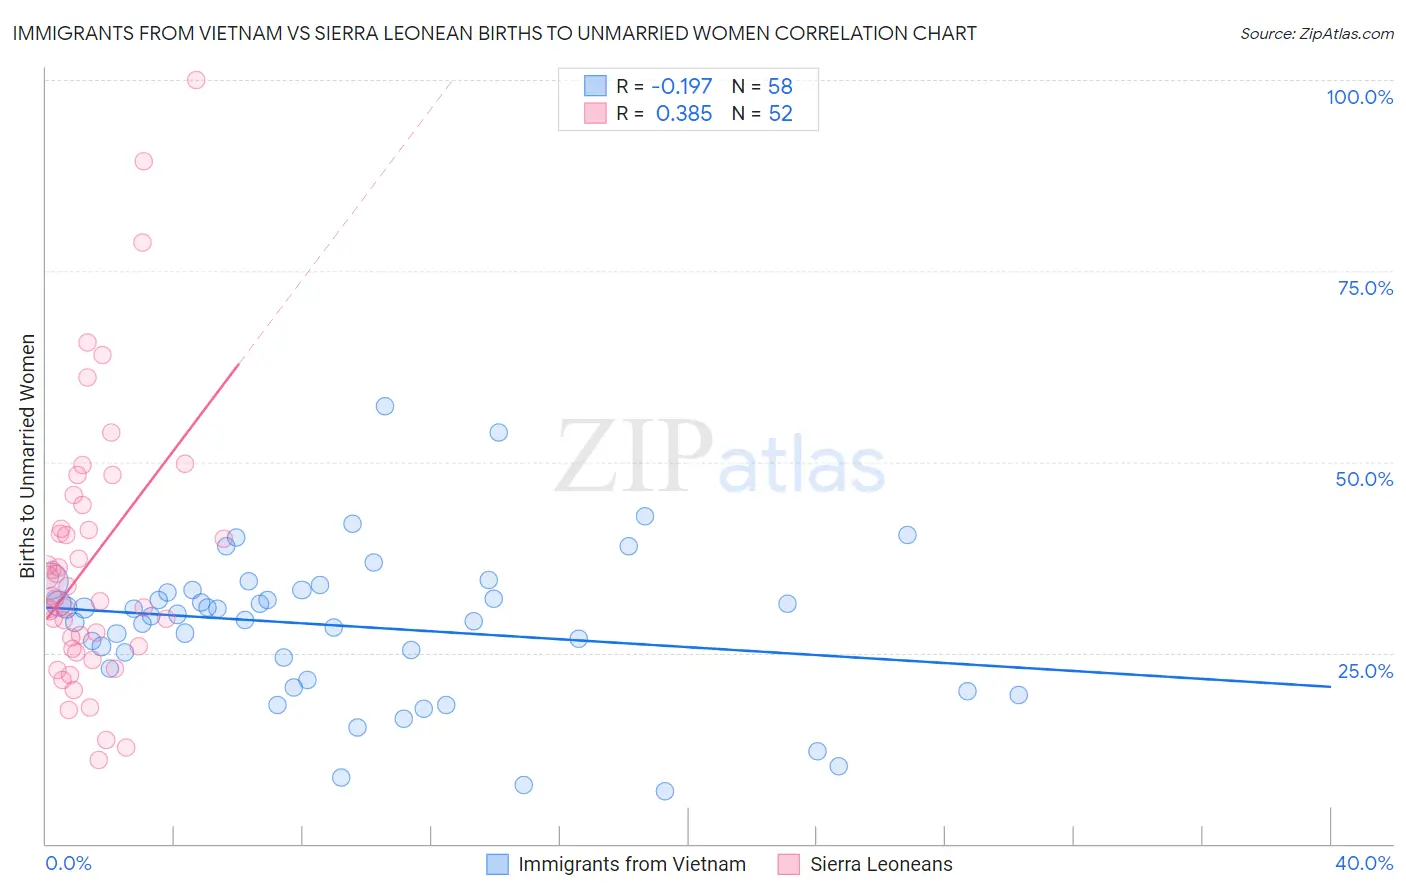
Immigrants from Vietnam vs Sierra Leonean Births to Unmarried Women Correlation Chart
The statistical analysis conducted on geographies consisting of 380,517,286 people shows a poor negative correlation between the proportion of Immigrants from Vietnam and percentage of births to unmarried women in the United States with a correlation coefficient (R) of -0.197 and weighted average of 29.3%. Similarly, the statistical analysis conducted on geographies consisting of 82,118,430 people shows a mild positive correlation between the proportion of Sierra Leoneans and percentage of births to unmarried women in the United States with a correlation coefficient (R) of 0.385 and weighted average of 34.9%, a difference of 19.1%.
Births to Unmarried Women Correlation Summary
| Measurement | Immigrants from Vietnam | Sierra Leonean |
| Minimum | 6.9% | 11.0% |
| Maximum | 57.3% | 100.0% |
| Range | 50.4% | 89.0% |
| Mean | 28.5% | 37.0% |
| Median | 29.9% | 32.2% |
| Interquartile 25% (IQ1) | 22.9% | 25.7% |
| Interquartile 75% (IQ3) | 33.2% | 42.9% |
| Interquartile Range (IQR) | 10.3% | 17.1% |
| Standard Deviation (Sample) | 9.9% | 18.0% |
| Standard Deviation (Population) | 9.9% | 17.9% |
Similar Demographics by Births to Unmarried Women
Demographics Similar to Immigrants from Vietnam by Births to Unmarried Women
In terms of births to unmarried women, the demographic groups most similar to Immigrants from Vietnam are Ukrainian (29.2%, a difference of 0.13%), Norwegian (29.3%, a difference of 0.23%), Estonian (29.2%, a difference of 0.26%), Immigrants from South Africa (29.3%, a difference of 0.27%), and Arab (29.2%, a difference of 0.30%).
| Demographics | Rating | Rank | Births to Unmarried Women |
| Immigrants | France | 97.3 /100 | #88 | Exceptional 29.0% |
| Immigrants | Saudi Arabia | 97.0 /100 | #89 | Exceptional 29.1% |
| Immigrants | Latvia | 96.8 /100 | #90 | Exceptional 29.1% |
| Immigrants | Fiji | 96.6 /100 | #91 | Exceptional 29.2% |
| Arabs | 96.5 /100 | #92 | Exceptional 29.2% |
| Estonians | 96.5 /100 | #93 | Exceptional 29.2% |
| Ukrainians | 96.3 /100 | #94 | Exceptional 29.2% |
| Immigrants | Vietnam | 96.1 /100 | #95 | Exceptional 29.3% |
| Norwegians | 95.8 /100 | #96 | Exceptional 29.3% |
| Immigrants | South Africa | 95.7 /100 | #97 | Exceptional 29.3% |
| Immigrants | Syria | 95.7 /100 | #98 | Exceptional 29.4% |
| Immigrants | Denmark | 95.3 /100 | #99 | Exceptional 29.4% |
| Luxembourgers | 95.2 /100 | #100 | Exceptional 29.4% |
| Immigrants | Northern Africa | 94.7 /100 | #101 | Exceptional 29.5% |
| Australians | 94.6 /100 | #102 | Exceptional 29.5% |
Demographics Similar to Sierra Leoneans by Births to Unmarried Women
In terms of births to unmarried women, the demographic groups most similar to Sierra Leoneans are Immigrants from Cambodia (34.8%, a difference of 0.22%), Immigrants from Middle Africa (34.9%, a difference of 0.25%), Marshallese (34.8%, a difference of 0.28%), Immigrants from Guyana (35.0%, a difference of 0.28%), and Immigrants from Cameroon (34.7%, a difference of 0.36%).
| Demographics | Rating | Rank | Births to Unmarried Women |
| French Canadians | 2.5 /100 | #232 | Tragic 34.4% |
| Bangladeshis | 2.5 /100 | #233 | Tragic 34.4% |
| Immigrants | Zaire | 2.3 /100 | #234 | Tragic 34.5% |
| Immigrants | Ghana | 2.2 /100 | #235 | Tragic 34.5% |
| Immigrants | Cameroon | 1.6 /100 | #236 | Tragic 34.7% |
| Marshallese | 1.6 /100 | #237 | Tragic 34.8% |
| Immigrants | Cambodia | 1.6 /100 | #238 | Tragic 34.8% |
| Sierra Leoneans | 1.4 /100 | #239 | Tragic 34.9% |
| Immigrants | Middle Africa | 1.2 /100 | #240 | Tragic 34.9% |
| Immigrants | Guyana | 1.2 /100 | #241 | Tragic 35.0% |
| Indonesians | 1.2 /100 | #242 | Tragic 35.0% |
| Japanese | 0.9 /100 | #243 | Tragic 35.2% |
| Guyanese | 0.9 /100 | #244 | Tragic 35.2% |
| Shoshone | 0.8 /100 | #245 | Tragic 35.3% |
| Nigerians | 0.7 /100 | #246 | Tragic 35.3% |