Tohono O'odham vs Immigrants from Trinidad and Tobago Average Family Size
COMPARE
Tohono O'odham
Immigrants from Trinidad and Tobago
Average Family Size
Average Family Size Comparison
Tohono O'odham
Immigrants from Trinidad and Tobago
3.53
AVERAGE FAMILY SIZE
100.0/ 100
METRIC RATING
11th/ 347
METRIC RANK
3.33
AVERAGE FAMILY SIZE
99.9/ 100
METRIC RATING
70th/ 347
METRIC RANK
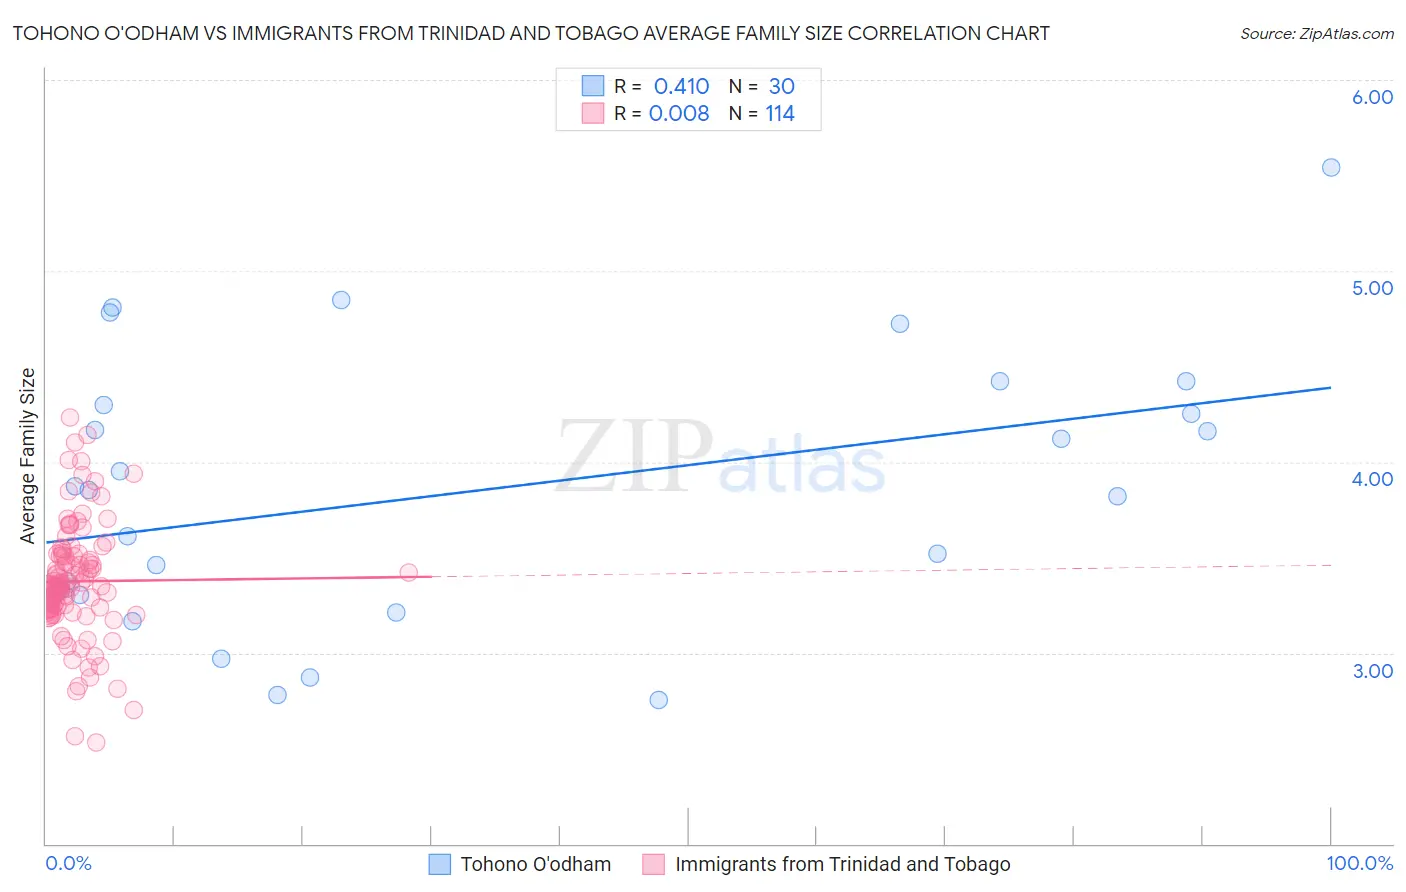
Tohono O'odham vs Immigrants from Trinidad and Tobago Average Family Size Correlation Chart
The statistical analysis conducted on geographies consisting of 58,718,905 people shows a moderate positive correlation between the proportion of Tohono O'odham and average family size in the United States with a correlation coefficient (R) of 0.410 and weighted average of 3.53. Similarly, the statistical analysis conducted on geographies consisting of 223,484,407 people shows no correlation between the proportion of Immigrants from Trinidad and Tobago and average family size in the United States with a correlation coefficient (R) of 0.008 and weighted average of 3.33, a difference of 6.1%.
Average Family Size Correlation Summary
| Measurement | Tohono O'odham | Immigrants from Trinidad and Tobago |
| Minimum | 2.75 | 2.53 |
| Maximum | 5.54 | 4.23 |
| Range | 2.79 | 1.70 |
| Mean | 3.83 | 3.37 |
| Median | 3.84 | 3.36 |
| Interquartile 25% (IQ1) | 3.31 | 3.23 |
| Interquartile 75% (IQ3) | 4.30 | 3.51 |
| Interquartile Range (IQR) | 0.99 | 0.28 |
| Standard Deviation (Sample) | 0.70 | 0.30 |
| Standard Deviation (Population) | 0.69 | 0.30 |
Similar Demographics by Average Family Size
Demographics Similar to Tohono O'odham by Average Family Size
In terms of average family size, the demographic groups most similar to Tohono O'odham are Immigrants from Mexico (3.52, a difference of 0.42%), Sioux (3.52, a difference of 0.50%), Immigrants from Central America (3.49, a difference of 1.1%), Tongan (3.49, a difference of 1.2%), and Ute (3.49, a difference of 1.2%).
| Demographics | Rating | Rank | Average Family Size |
| Pima | 100 /100 | #4 | Exceptional 3.75 |
| Navajo | 100.0 /100 | #5 | Exceptional 3.65 |
| Arapaho | 100.0 /100 | #6 | Exceptional 3.64 |
| Inupiat | 100.0 /100 | #7 | Exceptional 3.63 |
| Immigrants | Yemen | 100.0 /100 | #8 | Exceptional 3.60 |
| Hopi | 100.0 /100 | #9 | Exceptional 3.60 |
| Spanish American Indians | 100.0 /100 | #10 | Exceptional 3.58 |
| Tohono O'odham | 100.0 /100 | #11 | Exceptional 3.53 |
| Immigrants | Mexico | 100.0 /100 | #12 | Exceptional 3.52 |
| Sioux | 100.0 /100 | #13 | Exceptional 3.52 |
| Immigrants | Central America | 100.0 /100 | #14 | Exceptional 3.49 |
| Tongans | 100.0 /100 | #15 | Exceptional 3.49 |
| Ute | 100.0 /100 | #16 | Exceptional 3.49 |
| Immigrants | El Salvador | 100.0 /100 | #17 | Exceptional 3.49 |
| Salvadorans | 100.0 /100 | #18 | Exceptional 3.48 |
Demographics Similar to Immigrants from Trinidad and Tobago by Average Family Size
In terms of average family size, the demographic groups most similar to Immigrants from Trinidad and Tobago are Immigrants from West Indies (3.33, a difference of 0.010%), Immigrants (3.33, a difference of 0.050%), Immigrants from Cambodia (3.33, a difference of 0.080%), Immigrants from Caribbean (3.33, a difference of 0.080%), and Yaqui (3.32, a difference of 0.11%).
| Demographics | Rating | Rank | Average Family Size |
| Chinese | 100.0 /100 | #63 | Exceptional 3.34 |
| Dominicans | 99.9 /100 | #64 | Exceptional 3.34 |
| Immigrants | Laos | 99.9 /100 | #65 | Exceptional 3.34 |
| Immigrants | St. Vincent and the Grenadines | 99.9 /100 | #66 | Exceptional 3.34 |
| Immigrants | Jamaica | 99.9 /100 | #67 | Exceptional 3.33 |
| Immigrants | Cambodia | 99.9 /100 | #68 | Exceptional 3.33 |
| Immigrants | Immigrants | 99.9 /100 | #69 | Exceptional 3.33 |
| Immigrants | Trinidad and Tobago | 99.9 /100 | #70 | Exceptional 3.33 |
| Immigrants | West Indies | 99.9 /100 | #71 | Exceptional 3.33 |
| Immigrants | Caribbean | 99.9 /100 | #72 | Exceptional 3.33 |
| Yaqui | 99.9 /100 | #73 | Exceptional 3.32 |
| Immigrants | Sierra Leone | 99.9 /100 | #74 | Exceptional 3.32 |
| Immigrants | Barbados | 99.8 /100 | #75 | Exceptional 3.32 |
| Trinidadians and Tobagonians | 99.8 /100 | #76 | Exceptional 3.32 |
| Immigrants | Ecuador | 99.8 /100 | #77 | Exceptional 3.32 |