Pennsylvania German vs Immigrants from Trinidad and Tobago Average Family Size
COMPARE
Pennsylvania German
Immigrants from Trinidad and Tobago
Average Family Size
Average Family Size Comparison
Pennsylvania Germans
Immigrants from Trinidad and Tobago
3.19
AVERAGE FAMILY SIZE
9.3/ 100
METRIC RATING
219th/ 347
METRIC RANK
3.33
AVERAGE FAMILY SIZE
99.9/ 100
METRIC RATING
70th/ 347
METRIC RANK
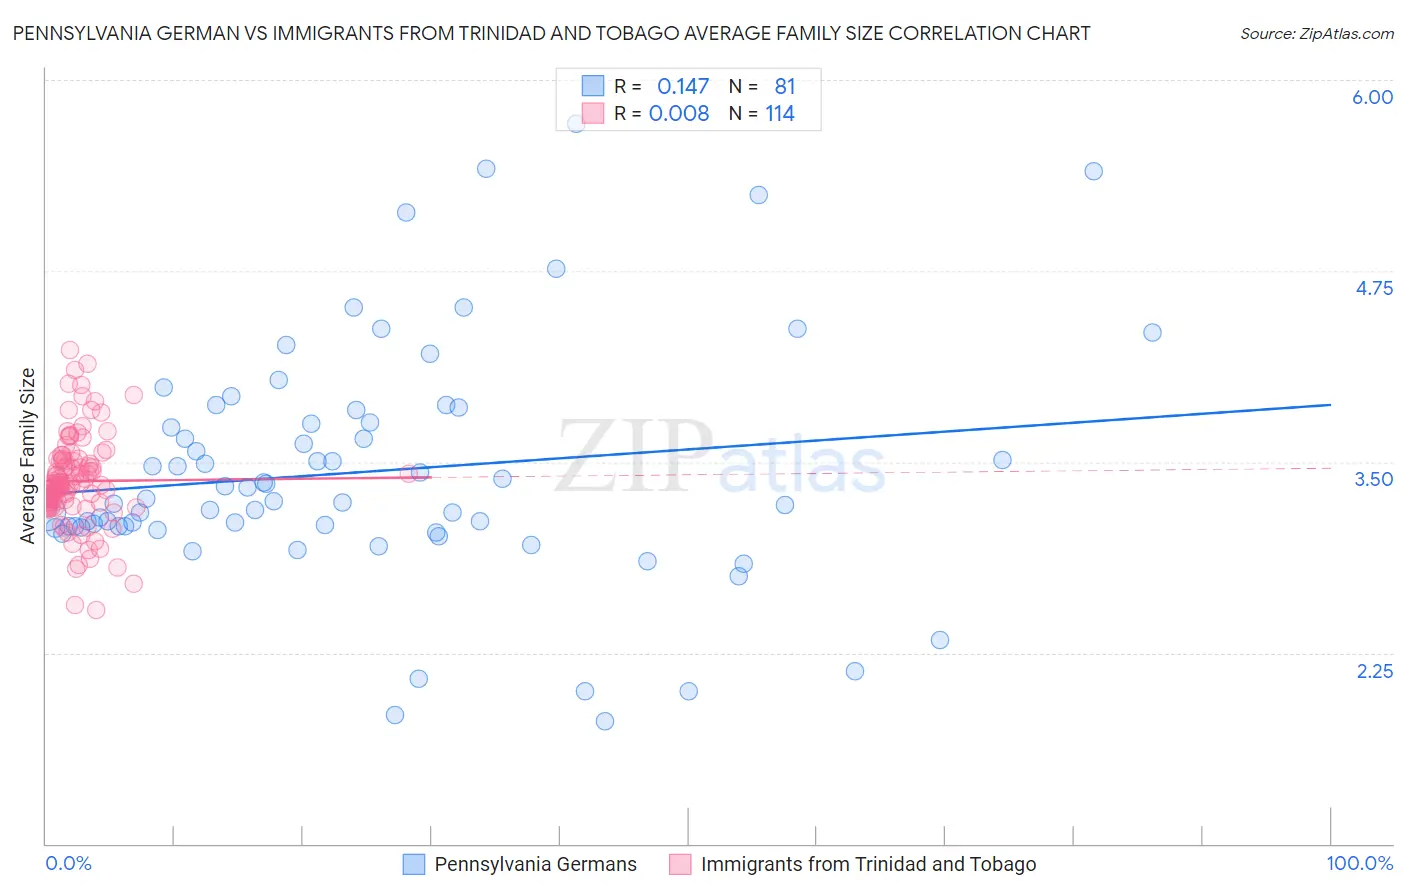
Pennsylvania German vs Immigrants from Trinidad and Tobago Average Family Size Correlation Chart
The statistical analysis conducted on geographies consisting of 234,061,809 people shows a poor positive correlation between the proportion of Pennsylvania Germans and average family size in the United States with a correlation coefficient (R) of 0.147 and weighted average of 3.19. Similarly, the statistical analysis conducted on geographies consisting of 223,484,407 people shows no correlation between the proportion of Immigrants from Trinidad and Tobago and average family size in the United States with a correlation coefficient (R) of 0.008 and weighted average of 3.33, a difference of 4.2%.
Average Family Size Correlation Summary
| Measurement | Pennsylvania German | Immigrants from Trinidad and Tobago |
| Minimum | 1.80 | 2.53 |
| Maximum | 5.71 | 4.23 |
| Range | 3.91 | 1.70 |
| Mean | 3.44 | 3.37 |
| Median | 3.24 | 3.36 |
| Interquartile 25% (IQ1) | 3.07 | 3.23 |
| Interquartile 75% (IQ3) | 3.80 | 3.51 |
| Interquartile Range (IQR) | 0.73 | 0.28 |
| Standard Deviation (Sample) | 0.78 | 0.30 |
| Standard Deviation (Population) | 0.77 | 0.30 |
Similar Demographics by Average Family Size
Demographics Similar to Pennsylvania Germans by Average Family Size
In terms of average family size, the demographic groups most similar to Pennsylvania Germans are Lebanese (3.19, a difference of 0.010%), French American Indian (3.20, a difference of 0.030%), Immigrants from Somalia (3.20, a difference of 0.050%), Delaware (3.20, a difference of 0.090%), and Bermudan (3.20, a difference of 0.090%).
| Demographics | Rating | Rank | Average Family Size |
| Creek | 12.1 /100 | #212 | Poor 3.20 |
| Mongolians | 11.5 /100 | #213 | Poor 3.20 |
| Somalis | 11.2 /100 | #214 | Poor 3.20 |
| Delaware | 11.1 /100 | #215 | Poor 3.20 |
| Bermudans | 11.0 /100 | #216 | Poor 3.20 |
| Immigrants | Somalia | 10.3 /100 | #217 | Poor 3.20 |
| French American Indians | 9.8 /100 | #218 | Tragic 3.20 |
| Pennsylvania Germans | 9.3 /100 | #219 | Tragic 3.19 |
| Lebanese | 9.1 /100 | #220 | Tragic 3.19 |
| Immigrants | Ukraine | 7.2 /100 | #221 | Tragic 3.19 |
| Immigrants | Kuwait | 7.2 /100 | #222 | Tragic 3.19 |
| Immigrants | Zimbabwe | 7.1 /100 | #223 | Tragic 3.19 |
| Syrians | 6.5 /100 | #224 | Tragic 3.19 |
| Cree | 6.2 /100 | #225 | Tragic 3.19 |
| Chickasaw | 6.0 /100 | #226 | Tragic 3.19 |
Demographics Similar to Immigrants from Trinidad and Tobago by Average Family Size
In terms of average family size, the demographic groups most similar to Immigrants from Trinidad and Tobago are Immigrants from West Indies (3.33, a difference of 0.010%), Immigrants (3.33, a difference of 0.050%), Immigrants from Cambodia (3.33, a difference of 0.080%), Immigrants from Caribbean (3.33, a difference of 0.080%), and Yaqui (3.32, a difference of 0.11%).
| Demographics | Rating | Rank | Average Family Size |
| Chinese | 100.0 /100 | #63 | Exceptional 3.34 |
| Dominicans | 99.9 /100 | #64 | Exceptional 3.34 |
| Immigrants | Laos | 99.9 /100 | #65 | Exceptional 3.34 |
| Immigrants | St. Vincent and the Grenadines | 99.9 /100 | #66 | Exceptional 3.34 |
| Immigrants | Jamaica | 99.9 /100 | #67 | Exceptional 3.33 |
| Immigrants | Cambodia | 99.9 /100 | #68 | Exceptional 3.33 |
| Immigrants | Immigrants | 99.9 /100 | #69 | Exceptional 3.33 |
| Immigrants | Trinidad and Tobago | 99.9 /100 | #70 | Exceptional 3.33 |
| Immigrants | West Indies | 99.9 /100 | #71 | Exceptional 3.33 |
| Immigrants | Caribbean | 99.9 /100 | #72 | Exceptional 3.33 |
| Yaqui | 99.9 /100 | #73 | Exceptional 3.32 |
| Immigrants | Sierra Leone | 99.9 /100 | #74 | Exceptional 3.32 |
| Immigrants | Barbados | 99.8 /100 | #75 | Exceptional 3.32 |
| Trinidadians and Tobagonians | 99.8 /100 | #76 | Exceptional 3.32 |
| Immigrants | Ecuador | 99.8 /100 | #77 | Exceptional 3.32 |