Immigrants from Oceania vs Costa Rican Single Father Households
COMPARE
Immigrants from Oceania
Costa Rican
Single Father Households
Single Father Households Comparison
Immigrants from Oceania
Costa Ricans
2.5%
SINGLE FATHER HOUSEHOLDS
5.8/ 100
METRIC RATING
239th/ 347
METRIC RANK
2.3%
SINGLE FATHER HOUSEHOLDS
44.1/ 100
METRIC RATING
178th/ 347
METRIC RANK
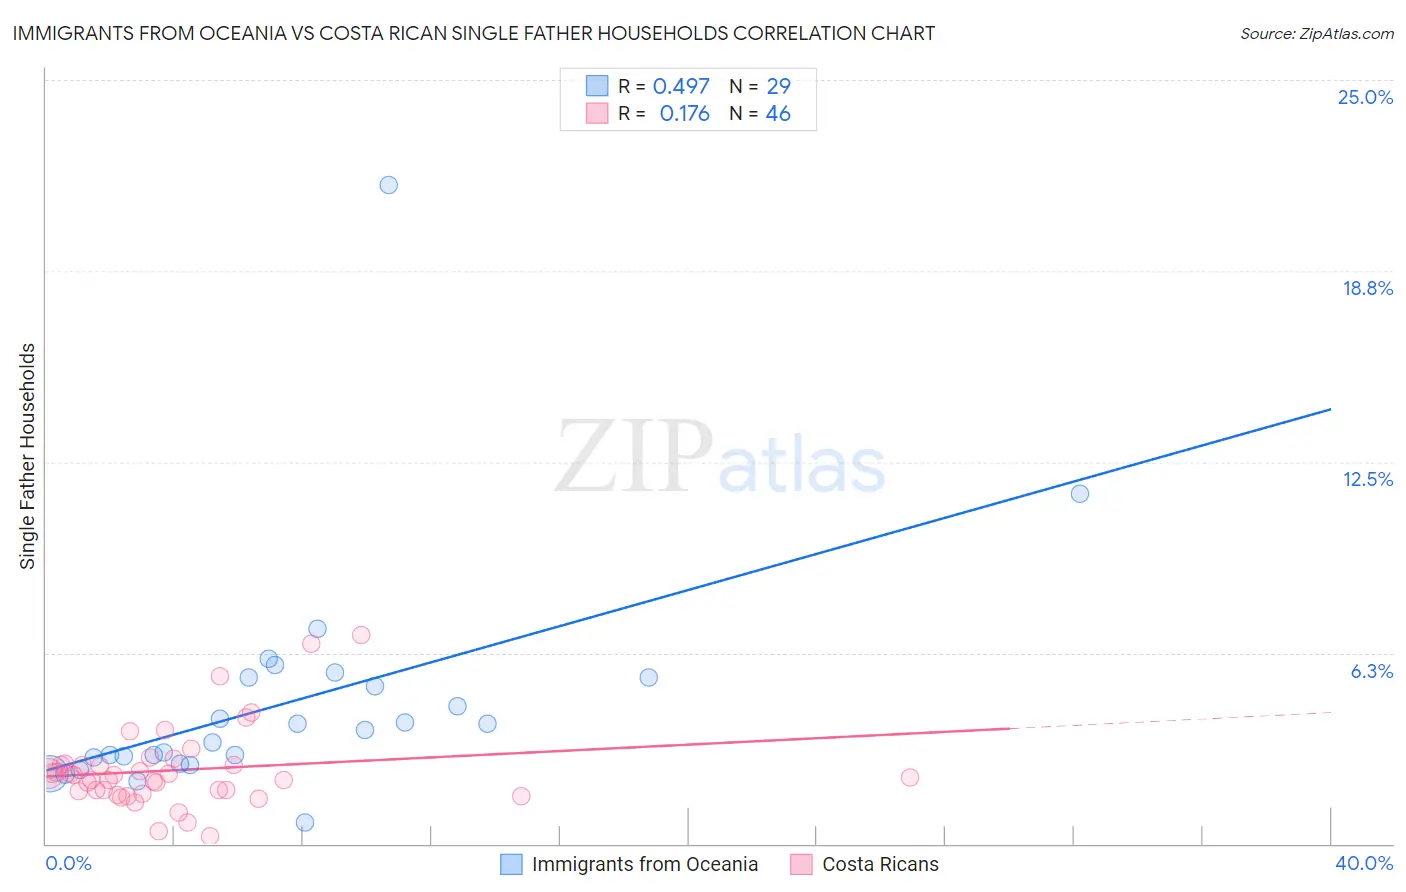
Immigrants from Oceania vs Costa Rican Single Father Households Correlation Chart
The statistical analysis conducted on geographies consisting of 303,379,404 people shows a moderate positive correlation between the proportion of Immigrants from Oceania and percentage of single father households in the United States with a correlation coefficient (R) of 0.497 and weighted average of 2.5%. Similarly, the statistical analysis conducted on geographies consisting of 252,556,792 people shows a poor positive correlation between the proportion of Costa Ricans and percentage of single father households in the United States with a correlation coefficient (R) of 0.176 and weighted average of 2.3%, a difference of 4.7%.
Single Father Households Correlation Summary
| Measurement | Immigrants from Oceania | Costa Rican |
| Minimum | 0.70% | 0.25% |
| Maximum | 21.5% | 6.9% |
| Range | 20.8% | 6.6% |
| Mean | 4.6% | 2.4% |
| Median | 3.7% | 2.2% |
| Interquartile 25% (IQ1) | 2.7% | 1.7% |
| Interquartile 75% (IQ3) | 5.4% | 2.6% |
| Interquartile Range (IQR) | 2.7% | 0.87% |
| Standard Deviation (Sample) | 3.8% | 1.3% |
| Standard Deviation (Population) | 3.8% | 1.3% |
Similar Demographics by Single Father Households
Demographics Similar to Immigrants from Oceania by Single Father Households
In terms of single father households, the demographic groups most similar to Immigrants from Oceania are Immigrants from Sierra Leone (2.5%, a difference of 0.010%), Sierra Leonean (2.5%, a difference of 0.040%), Cajun (2.5%, a difference of 0.090%), Immigrants (2.5%, a difference of 0.14%), and African (2.5%, a difference of 0.16%).
| Demographics | Rating | Rank | Single Father Households |
| Pennsylvania Germans | 7.3 /100 | #232 | Tragic 2.4% |
| Immigrants | Western Africa | 7.0 /100 | #233 | Tragic 2.4% |
| Africans | 6.3 /100 | #234 | Tragic 2.5% |
| Immigrants | Immigrants | 6.3 /100 | #235 | Tragic 2.5% |
| Cajuns | 6.1 /100 | #236 | Tragic 2.5% |
| Sierra Leoneans | 5.9 /100 | #237 | Tragic 2.5% |
| Immigrants | Sierra Leone | 5.8 /100 | #238 | Tragic 2.5% |
| Immigrants | Oceania | 5.8 /100 | #239 | Tragic 2.5% |
| Immigrants | Dominica | 4.8 /100 | #240 | Tragic 2.5% |
| Portuguese | 4.1 /100 | #241 | Tragic 2.5% |
| Osage | 4.1 /100 | #242 | Tragic 2.5% |
| Spaniards | 3.1 /100 | #243 | Tragic 2.5% |
| Immigrants | Middle Africa | 2.8 /100 | #244 | Tragic 2.5% |
| Basques | 2.5 /100 | #245 | Tragic 2.5% |
| Native Hawaiians | 2.5 /100 | #246 | Tragic 2.5% |
Demographics Similar to Costa Ricans by Single Father Households
In terms of single father households, the demographic groups most similar to Costa Ricans are Welsh (2.3%, a difference of 0.0%), Yugoslavian (2.3%, a difference of 0.020%), Jamaican (2.3%, a difference of 0.040%), Belgian (2.3%, a difference of 0.060%), and Immigrants from Panama (2.4%, a difference of 0.17%).
| Demographics | Rating | Rank | Single Father Households |
| Swedes | 61.6 /100 | #171 | Good 2.3% |
| Czechoslovakians | 58.9 /100 | #172 | Average 2.3% |
| Celtics | 55.4 /100 | #173 | Average 2.3% |
| Afghans | 50.0 /100 | #174 | Average 2.3% |
| Immigrants | Jamaica | 49.1 /100 | #175 | Average 2.3% |
| Danes | 48.2 /100 | #176 | Average 2.3% |
| Colombians | 48.0 /100 | #177 | Average 2.3% |
| Costa Ricans | 44.1 /100 | #178 | Average 2.3% |
| Welsh | 44.0 /100 | #179 | Average 2.3% |
| Yugoslavians | 43.9 /100 | #180 | Average 2.3% |
| Jamaicans | 43.5 /100 | #181 | Average 2.3% |
| Belgians | 43.3 /100 | #182 | Average 2.3% |
| Immigrants | Panama | 41.8 /100 | #183 | Average 2.4% |
| Sri Lankans | 41.8 /100 | #184 | Average 2.4% |
| Nigerians | 41.0 /100 | #185 | Average 2.4% |