American vs Arapaho Currently Married
COMPARE
American
Arapaho
Currently Married
Currently Married Comparison
Americans
Arapaho
48.0%
CURRENTLY MARRIED
95.7/ 100
METRIC RATING
90th/ 347
METRIC RANK
40.5%
CURRENTLY MARRIED
0.0/ 100
METRIC RATING
328th/ 347
METRIC RANK
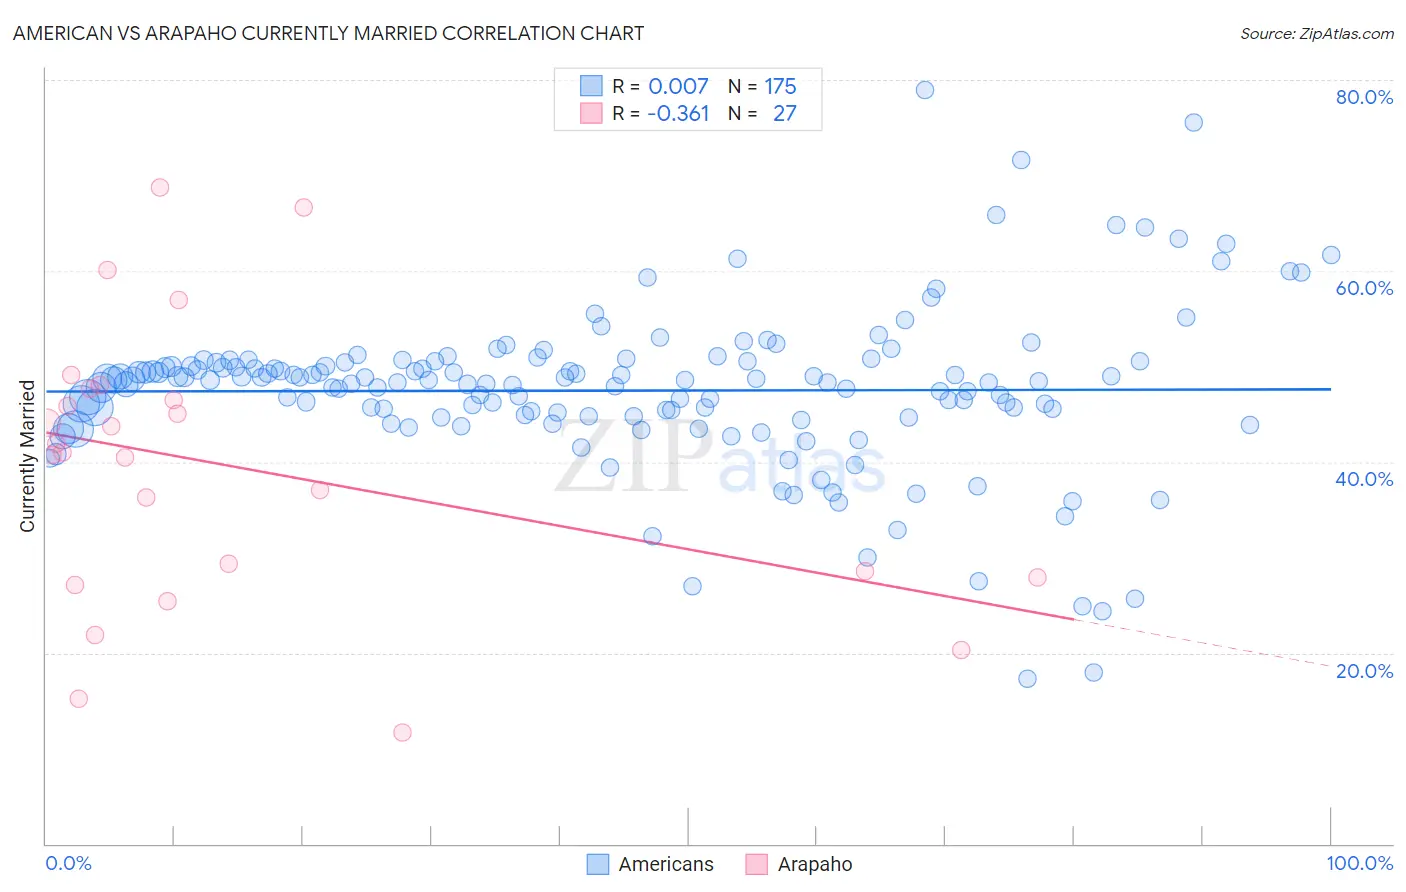
American vs Arapaho Currently Married Correlation Chart
The statistical analysis conducted on geographies consisting of 581,851,049 people shows no correlation between the proportion of Americans and percentage of population currently married in the United States with a correlation coefficient (R) of 0.007 and weighted average of 48.0%. Similarly, the statistical analysis conducted on geographies consisting of 29,779,567 people shows a mild negative correlation between the proportion of Arapaho and percentage of population currently married in the United States with a correlation coefficient (R) of -0.361 and weighted average of 40.5%, a difference of 18.3%.
Currently Married Correlation Summary
| Measurement | American | Arapaho |
| Minimum | 17.3% | 11.7% |
| Maximum | 79.0% | 68.7% |
| Range | 61.7% | 57.0% |
| Mean | 47.5% | 39.5% |
| Median | 48.4% | 41.0% |
| Interquartile 25% (IQ1) | 44.8% | 27.9% |
| Interquartile 75% (IQ3) | 50.5% | 47.6% |
| Interquartile Range (IQR) | 5.7% | 19.7% |
| Standard Deviation (Sample) | 8.5% | 14.5% |
| Standard Deviation (Population) | 8.5% | 14.3% |
Similar Demographics by Currently Married
Demographics Similar to Americans by Currently Married
In terms of currently married, the demographic groups most similar to Americans are Indian (Asian) (48.0%, a difference of 0.020%), Immigrants from Bolivia (47.9%, a difference of 0.030%), Korean (47.9%, a difference of 0.070%), Immigrants from Eastern Europe (48.0%, a difference of 0.080%), and Jordanian (48.0%, a difference of 0.10%).
| Demographics | Rating | Rank | Currently Married |
| Bolivians | 96.9 /100 | #83 | Exceptional 48.1% |
| Immigrants | Israel | 96.9 /100 | #84 | Exceptional 48.1% |
| French Canadians | 96.3 /100 | #85 | Exceptional 48.0% |
| Immigrants | Japan | 96.2 /100 | #86 | Exceptional 48.0% |
| Jordanians | 96.2 /100 | #87 | Exceptional 48.0% |
| Immigrants | Eastern Europe | 96.1 /100 | #88 | Exceptional 48.0% |
| Indians (Asian) | 95.8 /100 | #89 | Exceptional 48.0% |
| Americans | 95.7 /100 | #90 | Exceptional 48.0% |
| Immigrants | Bolivia | 95.6 /100 | #91 | Exceptional 47.9% |
| Koreans | 95.4 /100 | #92 | Exceptional 47.9% |
| Lebanese | 95.1 /100 | #93 | Exceptional 47.9% |
| Native Hawaiians | 95.0 /100 | #94 | Exceptional 47.9% |
| Immigrants | Bulgaria | 94.8 /100 | #95 | Exceptional 47.9% |
| Egyptians | 94.8 /100 | #96 | Exceptional 47.9% |
| Immigrants | Ukraine | 94.8 /100 | #97 | Exceptional 47.9% |
Demographics Similar to Arapaho by Currently Married
In terms of currently married, the demographic groups most similar to Arapaho are Senegalese (40.6%, a difference of 0.040%), Barbadian (40.6%, a difference of 0.22%), U.S. Virgin Islander (40.7%, a difference of 0.35%), Immigrants from Senegal (40.7%, a difference of 0.40%), and Immigrants from West Indies (40.7%, a difference of 0.41%).
| Demographics | Rating | Rank | Currently Married |
| Immigrants | Congo | 0.0 /100 | #321 | Tragic 41.1% |
| Immigrants | Haiti | 0.0 /100 | #322 | Tragic 41.0% |
| Immigrants | West Indies | 0.0 /100 | #323 | Tragic 40.7% |
| Immigrants | Senegal | 0.0 /100 | #324 | Tragic 40.7% |
| U.S. Virgin Islanders | 0.0 /100 | #325 | Tragic 40.7% |
| Barbadians | 0.0 /100 | #326 | Tragic 40.6% |
| Senegalese | 0.0 /100 | #327 | Tragic 40.6% |
| Arapaho | 0.0 /100 | #328 | Tragic 40.5% |
| Crow | 0.0 /100 | #329 | Tragic 40.4% |
| Immigrants | Dominica | 0.0 /100 | #330 | Tragic 40.3% |
| Immigrants | Barbados | 0.0 /100 | #331 | Tragic 40.3% |
| Immigrants | St. Vincent and the Grenadines | 0.0 /100 | #332 | Tragic 40.1% |
| Yup'ik | 0.0 /100 | #333 | Tragic 39.9% |
| Puerto Ricans | 0.0 /100 | #334 | Tragic 39.9% |
| Lumbee | 0.0 /100 | #335 | Tragic 39.8% |