American vs Puerto Rican Currently Married
COMPARE
American
Puerto Rican
Currently Married
Currently Married Comparison
Americans
Puerto Ricans
48.0%
CURRENTLY MARRIED
95.7/ 100
METRIC RATING
90th/ 347
METRIC RANK
39.9%
CURRENTLY MARRIED
0.0/ 100
METRIC RATING
334th/ 347
METRIC RANK
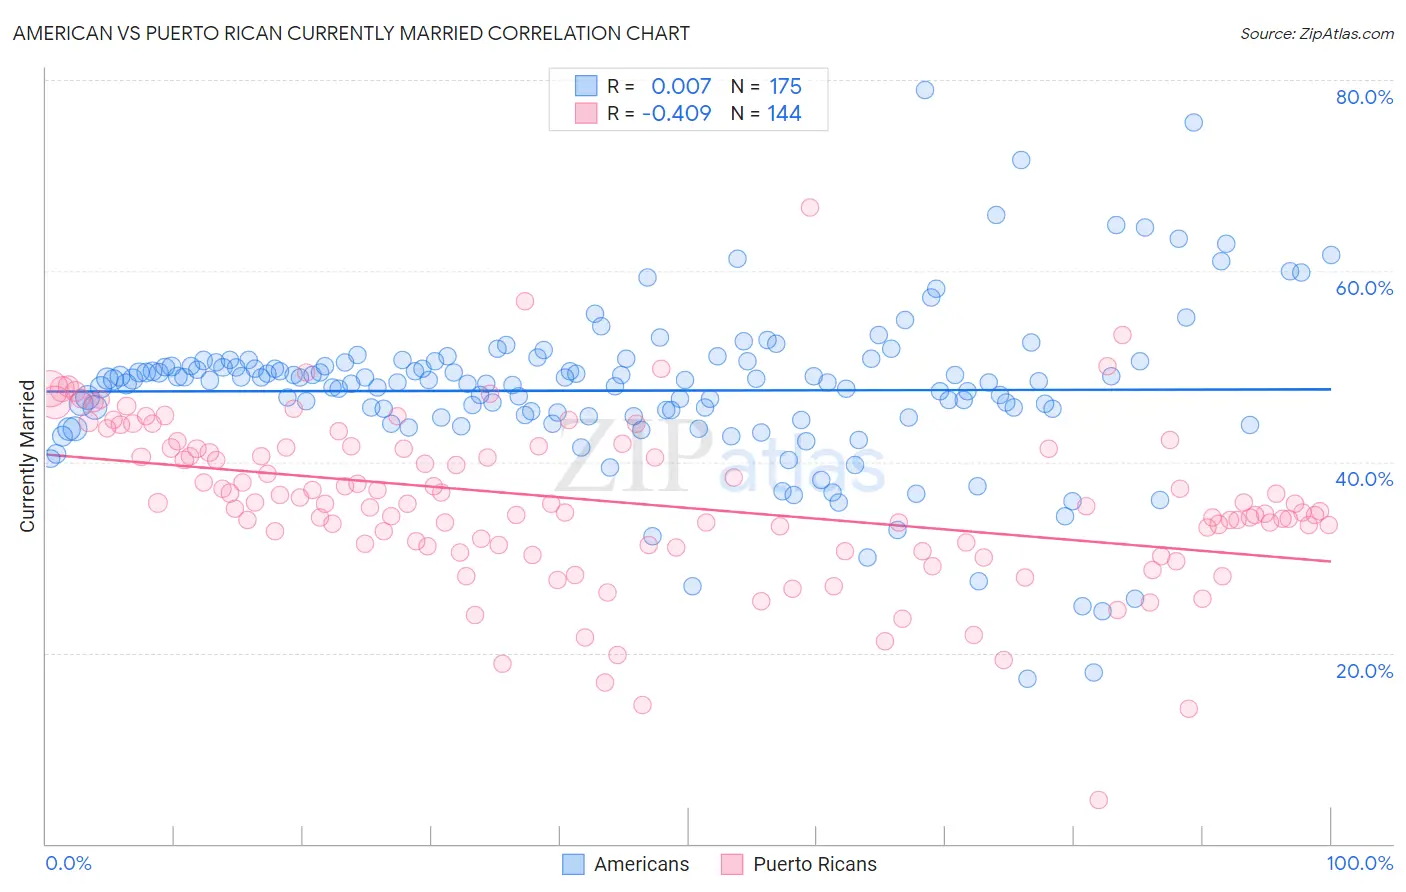
American vs Puerto Rican Currently Married Correlation Chart
The statistical analysis conducted on geographies consisting of 581,851,049 people shows no correlation between the proportion of Americans and percentage of population currently married in the United States with a correlation coefficient (R) of 0.007 and weighted average of 48.0%. Similarly, the statistical analysis conducted on geographies consisting of 528,221,069 people shows a moderate negative correlation between the proportion of Puerto Ricans and percentage of population currently married in the United States with a correlation coefficient (R) of -0.409 and weighted average of 39.9%, a difference of 20.2%.
Currently Married Correlation Summary
| Measurement | American | Puerto Rican |
| Minimum | 17.3% | 4.6% |
| Maximum | 79.0% | 66.7% |
| Range | 61.7% | 62.1% |
| Mean | 47.5% | 35.8% |
| Median | 48.4% | 35.4% |
| Interquartile 25% (IQ1) | 44.8% | 31.3% |
| Interquartile 75% (IQ3) | 50.5% | 41.4% |
| Interquartile Range (IQR) | 5.7% | 10.1% |
| Standard Deviation (Sample) | 8.5% | 8.6% |
| Standard Deviation (Population) | 8.5% | 8.6% |
Similar Demographics by Currently Married
Demographics Similar to Americans by Currently Married
In terms of currently married, the demographic groups most similar to Americans are Indian (Asian) (48.0%, a difference of 0.020%), Immigrants from Bolivia (47.9%, a difference of 0.030%), Korean (47.9%, a difference of 0.070%), Immigrants from Eastern Europe (48.0%, a difference of 0.080%), and Jordanian (48.0%, a difference of 0.10%).
| Demographics | Rating | Rank | Currently Married |
| Bolivians | 96.9 /100 | #83 | Exceptional 48.1% |
| Immigrants | Israel | 96.9 /100 | #84 | Exceptional 48.1% |
| French Canadians | 96.3 /100 | #85 | Exceptional 48.0% |
| Immigrants | Japan | 96.2 /100 | #86 | Exceptional 48.0% |
| Jordanians | 96.2 /100 | #87 | Exceptional 48.0% |
| Immigrants | Eastern Europe | 96.1 /100 | #88 | Exceptional 48.0% |
| Indians (Asian) | 95.8 /100 | #89 | Exceptional 48.0% |
| Americans | 95.7 /100 | #90 | Exceptional 48.0% |
| Immigrants | Bolivia | 95.6 /100 | #91 | Exceptional 47.9% |
| Koreans | 95.4 /100 | #92 | Exceptional 47.9% |
| Lebanese | 95.1 /100 | #93 | Exceptional 47.9% |
| Native Hawaiians | 95.0 /100 | #94 | Exceptional 47.9% |
| Immigrants | Bulgaria | 94.8 /100 | #95 | Exceptional 47.9% |
| Egyptians | 94.8 /100 | #96 | Exceptional 47.9% |
| Immigrants | Ukraine | 94.8 /100 | #97 | Exceptional 47.9% |
Demographics Similar to Puerto Ricans by Currently Married
In terms of currently married, the demographic groups most similar to Puerto Ricans are Yup'ik (39.9%, a difference of 0.010%), Lumbee (39.8%, a difference of 0.16%), British West Indian (39.8%, a difference of 0.34%), Immigrants from St. Vincent and the Grenadines (40.1%, a difference of 0.41%), and Black/African American (39.6%, a difference of 0.72%).
| Demographics | Rating | Rank | Currently Married |
| Senegalese | 0.0 /100 | #327 | Tragic 40.6% |
| Arapaho | 0.0 /100 | #328 | Tragic 40.5% |
| Crow | 0.0 /100 | #329 | Tragic 40.4% |
| Immigrants | Dominica | 0.0 /100 | #330 | Tragic 40.3% |
| Immigrants | Barbados | 0.0 /100 | #331 | Tragic 40.3% |
| Immigrants | St. Vincent and the Grenadines | 0.0 /100 | #332 | Tragic 40.1% |
| Yup'ik | 0.0 /100 | #333 | Tragic 39.9% |
| Puerto Ricans | 0.0 /100 | #334 | Tragic 39.9% |
| Lumbee | 0.0 /100 | #335 | Tragic 39.8% |
| British West Indians | 0.0 /100 | #336 | Tragic 39.8% |
| Blacks/African Americans | 0.0 /100 | #337 | Tragic 39.6% |
| Cape Verdeans | 0.0 /100 | #338 | Tragic 39.6% |
| Dominicans | 0.0 /100 | #339 | Tragic 39.5% |
| Immigrants | Grenada | 0.0 /100 | #340 | Tragic 39.1% |
| Navajo | 0.0 /100 | #341 | Tragic 39.0% |