Alaska Native vs Arapaho Currently Married

COMPARE

Alaska Native
Race
Ancestry
AfghanAfricanAlaska NativeAlaskan AthabascanAlbanianAleutAlsatianAmericanApacheArabArgentineanArmenianAssyrian/Chaldean/SyriacAustralianAustrianBahamianBangladeshiBarbadianBasqueBelgianBelizeanBermudanBhutaneseBlackfeetBolivianBrazilianBritishBritish West IndianBulgarianBurmeseCajunCambodianCanadianCape VerdeanCarpatho RusynCelticCentral AmericanCentral American IndianCherokeeCheyenneChickasawChileanChineseChippewaChoctawColombianColvilleComancheCosta RicanCreeCreekCroatianCrowCubanCypriotCzechCzechoslovakianDanishDelawareDominicanDutchDutch West IndianEastern EuropeanEcuadorianEgyptianEnglishEstonianEthiopianEuropeanFijianFilipinoFinnishFrenchFrench American IndianFrench CanadianGermanGerman RussianGhanaianGreekGuamanian/ChamorroGuatemalanGuyaneseHaitianHmongHonduranHopiHoumaHungarianIcelanderIndian (Asian)IndonesianInupiatIranianIraqiIrishIroquoisIsraeliItalianJamaicanJapaneseJordanianKenyanKiowaKoreanLaotianLatvianLebaneseLiberianLithuanianLumbeeLuxembourgerMacedonianMalaysianMalteseMarshalleseMenomineeMexicanMexican American IndianMongolianMoroccanNative HawaiianNavajoNepaleseNew ZealanderNicaraguanNigerianNorthern EuropeanNorwegianOkinawanOsageOttawaPaiutePakistaniPalestinianPanamanianParaguayanPennsylvania GermanPeruvianPimaPolishPortuguesePotawatomiPuebloPuerto RicanPuget Sound SalishRomanianRussianSalvadoranSamoanScandinavianScotch-IrishScottishSeminoleSenegaleseSerbianShoshoneSierra LeoneanSiouxSlavicSlovakSloveneSomaliSouth AfricanSouth AmericanSouth American IndianSoviet UnionSpaniardSpanishSpanish AmericanSpanish American IndianSri LankanSubsaharan AfricanSudaneseSwedishSwissSyrianTaiwaneseThaiTlingit-HaidaTohono O'OdhamTonganTrinidadian and TobagonianTsimshianTurkishU.S. Virgin IslanderUgandanUkrainianUruguayanUteVenezuelanVietnameseWelshWest IndianYakamaYaquiYugoslavianYumanYup'ikZimbabwean
Immigration
NonimmigrantsImmigrantsAfghanistanAfricaAlbaniaArgentinaArmeniaAsiaAustraliaAustriaBahamasBangladeshBarbadosBelarusBelgiumBelizeBoliviaBosnia and HerzegovinaBrazilBulgariaBurma/MyanmarCabo VerdeCambodiaCameroonCanadaCaribbeanCentral AmericaChileChinaColombiaCongoCosta RicaCroatiaCubaCzechoslovakiaDenmarkDominicaDominican RepublicEastern AfricaEastern AsiaEastern EuropeEcuadorEgyptEl SalvadorEnglandEritreaEthiopiaEuropeFijiFranceGermanyGhanaGreeceGrenadaGuatemalaGuyanaHaitiHondurasHong KongHungaryIndiaIndonesiaIranIraqIrelandIsraelItalyJamaicaJapanJordanKazakhstanKenyaKoreaKuwaitLaosLatin AmericaLatviaLebanonLiberiaLithuaniaMalaysiaMexicoMicronesiaMiddle AfricaMoldovaMoroccoNepalNetherlandsNicaraguaNigeriaNorth AmericaNorth MacedoniaNorthern AfricaNorthern EuropeNorwayOceaniaPakistanPanamaPeruPhilippinesPolandPortugalRomaniaRussiaSaudi ArabiaScotlandSenegalSerbiaSierra LeoneSingaporeSomaliaSouth AfricaSouth AmericaSouth Central AsiaSouth Eastern AsiaSouthern EuropeSpainSri LankaSt. Vincent and the GrenadinesSudanSwedenSwitzerlandSyriaTaiwanThailandTrinidad and TobagoTurkeyUgandaUkraineUruguayUzbekistanVenezuelaVietnamWest IndiesWestern AfricaWestern AsiaWestern EuropeYemenZaireZimbabweAzores
Arapaho
Race
Ancestry
AfghanAfricanAlaskan AthabascanAlbanianAleutAlsatianAmericanApacheArabArapahoArgentineanArmenianAssyrian/Chaldean/SyriacAustralianAustrianBahamianBangladeshiBarbadianBasqueBelgianBelizeanBermudanBhutaneseBlackfeetBolivianBrazilianBritishBritish West IndianBulgarianBurmeseCajunCambodianCanadianCape VerdeanCarpatho RusynCelticCentral AmericanCentral American IndianCherokeeCheyenneChickasawChileanChineseChippewaChoctawColombianColvilleComancheCosta RicanCreeCreekCroatianCrowCubanCypriotCzechCzechoslovakianDanishDelawareDominicanDutchDutch West IndianEastern EuropeanEcuadorianEgyptianEnglishEstonianEthiopianEuropeanFijianFilipinoFinnishFrenchFrench American IndianFrench CanadianGermanGerman RussianGhanaianGreekGuamanian/ChamorroGuatemalanGuyaneseHaitianHmongHonduranHopiHoumaHungarianIcelanderIndian (Asian)IndonesianInupiatIranianIraqiIrishIroquoisIsraeliItalianJamaicanJapaneseJordanianKenyanKiowaKoreanLaotianLatvianLebaneseLiberianLithuanianLumbeeLuxembourgerMacedonianMalaysianMalteseMarshalleseMenomineeMexicanMexican American IndianMongolianMoroccanNative HawaiianNavajoNepaleseNew ZealanderNicaraguanNigerianNorthern EuropeanNorwegianOkinawanOsageOttawaPaiutePakistaniPalestinianPanamanianParaguayanPennsylvania GermanPeruvianPimaPolishPortuguesePotawatomiPuebloPuerto RicanPuget Sound SalishRomanianRussianSalvadoranSamoanScandinavianScotch-IrishScottishSeminoleSenegaleseSerbianShoshoneSierra LeoneanSiouxSlavicSlovakSloveneSomaliSouth AfricanSouth AmericanSouth American IndianSoviet UnionSpaniardSpanishSpanish AmericanSpanish American IndianSri LankanSubsaharan AfricanSudaneseSwedishSwissSyrianTaiwaneseThaiTlingit-HaidaTohono O'OdhamTonganTrinidadian and TobagonianTsimshianTurkishU.S. Virgin IslanderUgandanUkrainianUruguayanUteVenezuelanVietnameseWelshWest IndianYakamaYaquiYugoslavianYumanYup'ikZimbabwean
Immigration
NonimmigrantsImmigrantsAfghanistanAfricaAlbaniaArgentinaArmeniaAsiaAustraliaAustriaBahamasBangladeshBarbadosBelarusBelgiumBelizeBoliviaBosnia and HerzegovinaBrazilBulgariaBurma/MyanmarCabo VerdeCambodiaCameroonCanadaCaribbeanCentral AmericaChileChinaColombiaCongoCosta RicaCroatiaCubaCzechoslovakiaDenmarkDominicaDominican RepublicEastern AfricaEastern AsiaEastern EuropeEcuadorEgyptEl SalvadorEnglandEritreaEthiopiaEuropeFijiFranceGermanyGhanaGreeceGrenadaGuatemalaGuyanaHaitiHondurasHong KongHungaryIndiaIndonesiaIranIraqIrelandIsraelItalyJamaicaJapanJordanKazakhstanKenyaKoreaKuwaitLaosLatin AmericaLatviaLebanonLiberiaLithuaniaMalaysiaMexicoMicronesiaMiddle AfricaMoldovaMoroccoNepalNetherlandsNicaraguaNigeriaNorth AmericaNorth MacedoniaNorthern AfricaNorthern EuropeNorwayOceaniaPakistanPanamaPeruPhilippinesPolandPortugalRomaniaRussiaSaudi ArabiaScotlandSenegalSerbiaSierra LeoneSingaporeSomaliaSouth AfricaSouth AmericaSouth Central AsiaSouth Eastern AsiaSouthern EuropeSpainSri LankaSt. Vincent and the GrenadinesSudanSwedenSwitzerlandSyriaTaiwanThailandTrinidad and TobagoTurkeyUgandaUkraineUruguayUzbekistanVenezuelaVietnamWest IndiesWestern AfricaWestern AsiaWestern EuropeYemenZaireZimbabweAzores
Currently Married
Income
Poverty
Unemployment
Labor Participation
Family Structure
Vehicle Availability
Education Level
Disability

Currently Married Comparison

Alaska Natives

Arapaho

Tragic
Tragic
45.5%
CURRENTLY MARRIED
7.0/ 100
METRIC RATING
213th/ 347
METRIC RANK
40.5%
CURRENTLY MARRIED
0.0/ 100
METRIC RATING
328th/ 347
METRIC RANK

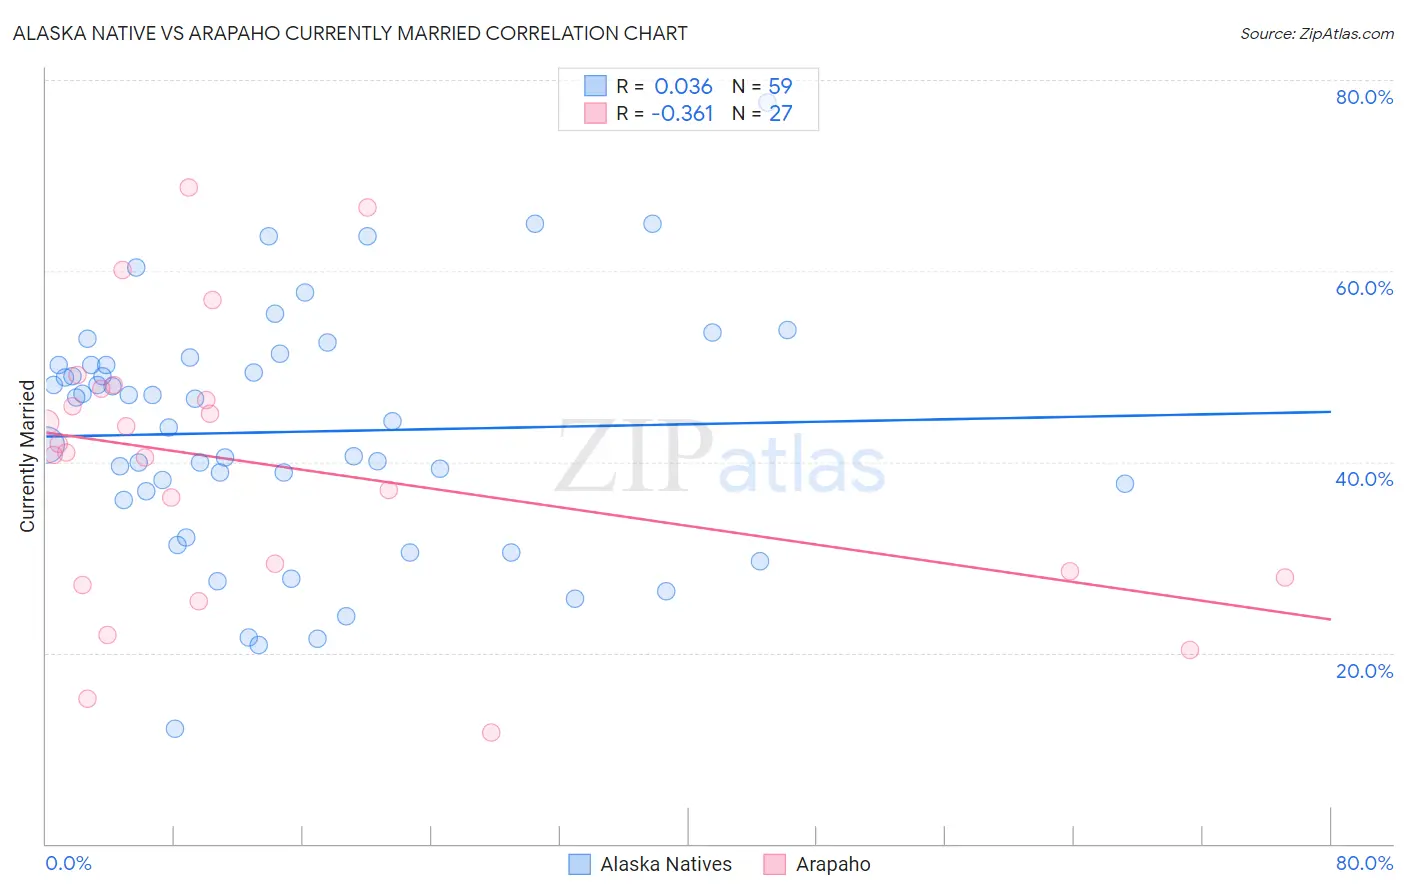
Alaska Native vs Arapaho Currently Married Correlation Chart

The statistical analysis conducted on geographies consisting of 76,776,837 people shows no correlation between the proportion of Alaska Natives and percentage of population currently married in the United States with a correlation coefficient (R) of 0.036 and weighted average of 45.5%. Similarly, the statistical analysis conducted on geographies consisting of 29,779,567 people shows a mild negative correlation between the proportion of Arapaho and percentage of population currently married in the United States with a correlation coefficient (R) of -0.361 and weighted average of 40.5%, a difference of 12.3%.
Alaska Native vs Arapaho Currently Married

Currently Married Correlation Summary

MeasurementAlaska NativeArapaho
Minimum12.1%11.7%
Maximum77.7%68.7%
Range65.6%57.0%
Mean43.1%39.5%
Median44.2%41.0%
Interquartile 25% (IQ1)36.0%27.9%
Interquartile 75% (IQ3)50.2%47.6%
Interquartile Range (IQR)14.1%19.7%
Standard Deviation (Sample)12.8%14.5%
Standard Deviation (Population)12.7%14.3%

Similar Demographics by Currently Married

Demographics Similar to Alaska Natives by Currently Married

In terms of currently married, the demographic groups most similar to Alaska Natives are Marshallese (45.5%, a difference of 0.030%), Houma (45.5%, a difference of 0.040%), Dutch West Indian (45.5%, a difference of 0.040%), German Russian (45.5%, a difference of 0.040%), and Uruguayan (45.6%, a difference of 0.12%).
DemographicsRating | RankCurrently Married
Immigrants | Immigrants
11.2
/100
|
#206
Poor
45.8%
Immigrants | South America
10.8
/100
|
#207
Poor
45.7%
Alsatians
10.8
/100
|
#208
Poor
45.7%
Immigrants | Micronesia
8.8
/100
|
#209
Tragic
45.6%
Uruguayans
7.9
/100
|
#210
Tragic
45.6%
Houma
7.2
/100
|
#211
Tragic
45.5%
Marshallese
7.2
/100
|
#212
Tragic
45.5%
Alaska Natives
7.0
/100
|
#213
Tragic
45.5%
Dutch West Indians
6.7
/100
|
#214
Tragic
45.5%
German Russians
6.7
/100
|
#215
Tragic
45.5%
Immigrants | Morocco
5.5
/100
|
#216
Tragic
45.4%
Immigrants | Thailand
5.1
/100
|
#217
Tragic
45.4%
Panamanians
4.0
/100
|
#218
Tragic
45.3%
Immigrants | Portugal
3.5
/100
|
#219
Tragic
45.2%
Kenyans
3.1
/100
|
#220
Tragic
45.2%

Demographics Similar to Arapaho by Currently Married

In terms of currently married, the demographic groups most similar to Arapaho are Senegalese (40.6%, a difference of 0.040%), Barbadian (40.6%, a difference of 0.22%), U.S. Virgin Islander (40.7%, a difference of 0.35%), Immigrants from Senegal (40.7%, a difference of 0.40%), and Immigrants from West Indies (40.7%, a difference of 0.41%).
DemographicsRating | RankCurrently Married
Immigrants | Congo
0.0
/100
|
#321
Tragic
41.1%
Immigrants | Haiti
0.0
/100
|
#322
Tragic
41.0%
Immigrants | West Indies
0.0
/100
|
#323
Tragic
40.7%
Immigrants | Senegal
0.0
/100
|
#324
Tragic
40.7%
U.S. Virgin Islanders
0.0
/100
|
#325
Tragic
40.7%
Barbadians
0.0
/100
|
#326
Tragic
40.6%
Senegalese
0.0
/100
|
#327
Tragic
40.6%
Arapaho
0.0
/100
|
#328
Tragic
40.5%
Crow
0.0
/100
|
#329
Tragic
40.4%
Immigrants | Dominica
0.0
/100
|
#330
Tragic
40.3%
Immigrants | Barbados
0.0
/100
|
#331
Tragic
40.3%
Immigrants | St. Vincent and the Grenadines
0.0
/100
|
#332
Tragic
40.1%
Yup'ik
0.0
/100
|
#333
Tragic
39.9%
Puerto Ricans
0.0
/100
|
#334
Tragic
39.9%
Lumbee
0.0
/100
|
#335
Tragic
39.8%