Immigrants from Zimbabwe vs Arapaho Currently Married
COMPARE
Immigrants from Zimbabwe
Arapaho
Currently Married
Currently Married Comparison
Immigrants from Zimbabwe
Arapaho
46.7%
CURRENTLY MARRIED
52.4/ 100
METRIC RATING
171st/ 347
METRIC RANK
40.5%
CURRENTLY MARRIED
0.0/ 100
METRIC RATING
328th/ 347
METRIC RANK
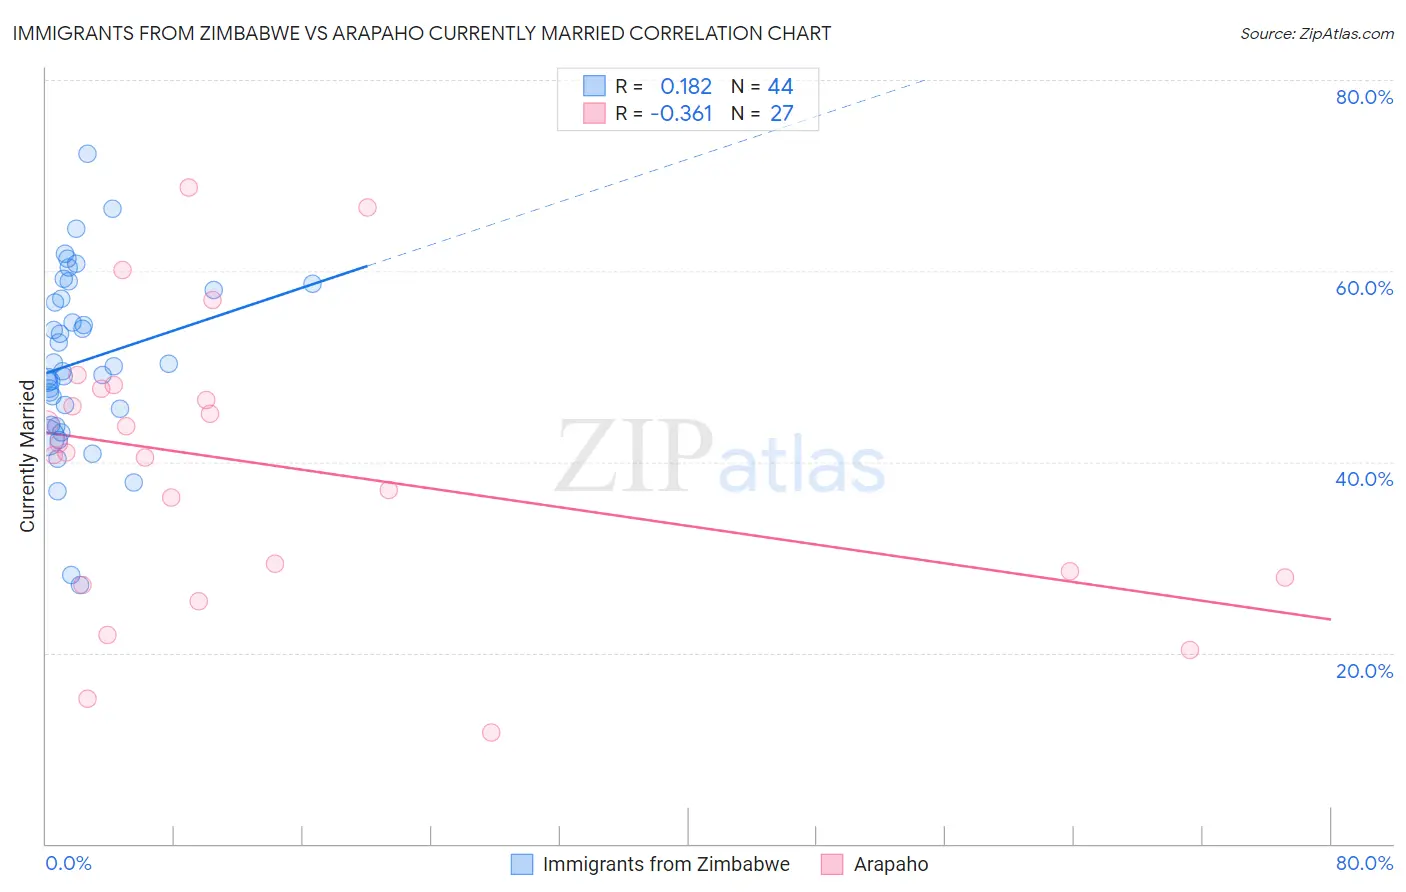
Immigrants from Zimbabwe vs Arapaho Currently Married Correlation Chart
The statistical analysis conducted on geographies consisting of 117,813,548 people shows a poor positive correlation between the proportion of Immigrants from Zimbabwe and percentage of population currently married in the United States with a correlation coefficient (R) of 0.182 and weighted average of 46.7%. Similarly, the statistical analysis conducted on geographies consisting of 29,779,567 people shows a mild negative correlation between the proportion of Arapaho and percentage of population currently married in the United States with a correlation coefficient (R) of -0.361 and weighted average of 40.5%, a difference of 15.1%.
Currently Married Correlation Summary
| Measurement | Immigrants from Zimbabwe | Arapaho |
| Minimum | 27.1% | 11.7% |
| Maximum | 72.3% | 68.7% |
| Range | 45.2% | 57.0% |
| Mean | 50.5% | 39.5% |
| Median | 49.7% | 41.0% |
| Interquartile 25% (IQ1) | 44.7% | 27.9% |
| Interquartile 75% (IQ3) | 57.6% | 47.6% |
| Interquartile Range (IQR) | 12.9% | 19.7% |
| Standard Deviation (Sample) | 9.3% | 14.5% |
| Standard Deviation (Population) | 9.2% | 14.3% |
Similar Demographics by Currently Married
Demographics Similar to Immigrants from Zimbabwe by Currently Married
In terms of currently married, the demographic groups most similar to Immigrants from Zimbabwe are Aleut (46.7%, a difference of 0.010%), Tlingit-Haida (46.7%, a difference of 0.050%), Peruvian (46.6%, a difference of 0.090%), Immigrants from Brazil (46.6%, a difference of 0.090%), and Hawaiian (46.6%, a difference of 0.14%).
| Demographics | Rating | Rank | Currently Married |
| Immigrants | Western Asia | 64.2 /100 | #164 | Good 46.9% |
| Samoans | 59.8 /100 | #165 | Average 46.8% |
| Immigrants | Syria | 59.3 /100 | #166 | Average 46.8% |
| Spaniards | 58.8 /100 | #167 | Average 46.8% |
| Immigrants | Afghanistan | 58.2 /100 | #168 | Average 46.8% |
| Armenians | 58.2 /100 | #169 | Average 46.8% |
| Immigrants | Latvia | 56.7 /100 | #170 | Average 46.7% |
| Immigrants | Zimbabwe | 52.4 /100 | #171 | Average 46.7% |
| Aleuts | 52.0 /100 | #172 | Average 46.7% |
| Tlingit-Haida | 51.2 /100 | #173 | Average 46.7% |
| Peruvians | 50.0 /100 | #174 | Average 46.6% |
| Immigrants | Brazil | 49.9 /100 | #175 | Average 46.6% |
| Hawaiians | 48.6 /100 | #176 | Average 46.6% |
| Israelis | 48.6 /100 | #177 | Average 46.6% |
| Chickasaw | 47.8 /100 | #178 | Average 46.6% |
Demographics Similar to Arapaho by Currently Married
In terms of currently married, the demographic groups most similar to Arapaho are Senegalese (40.6%, a difference of 0.040%), Barbadian (40.6%, a difference of 0.22%), U.S. Virgin Islander (40.7%, a difference of 0.35%), Immigrants from Senegal (40.7%, a difference of 0.40%), and Immigrants from West Indies (40.7%, a difference of 0.41%).
| Demographics | Rating | Rank | Currently Married |
| Immigrants | Congo | 0.0 /100 | #321 | Tragic 41.1% |
| Immigrants | Haiti | 0.0 /100 | #322 | Tragic 41.0% |
| Immigrants | West Indies | 0.0 /100 | #323 | Tragic 40.7% |
| Immigrants | Senegal | 0.0 /100 | #324 | Tragic 40.7% |
| U.S. Virgin Islanders | 0.0 /100 | #325 | Tragic 40.7% |
| Barbadians | 0.0 /100 | #326 | Tragic 40.6% |
| Senegalese | 0.0 /100 | #327 | Tragic 40.6% |
| Arapaho | 0.0 /100 | #328 | Tragic 40.5% |
| Crow | 0.0 /100 | #329 | Tragic 40.4% |
| Immigrants | Dominica | 0.0 /100 | #330 | Tragic 40.3% |
| Immigrants | Barbados | 0.0 /100 | #331 | Tragic 40.3% |
| Immigrants | St. Vincent and the Grenadines | 0.0 /100 | #332 | Tragic 40.1% |
| Yup'ik | 0.0 /100 | #333 | Tragic 39.9% |
| Puerto Ricans | 0.0 /100 | #334 | Tragic 39.9% |
| Lumbee | 0.0 /100 | #335 | Tragic 39.8% |