Taiwanese vs Arapaho Currently Married
COMPARE
Taiwanese
Arapaho
Currently Married
Currently Married Comparison
Taiwanese
Arapaho
45.8%
CURRENTLY MARRIED
11.7/ 100
METRIC RATING
203rd/ 347
METRIC RANK
40.5%
CURRENTLY MARRIED
0.0/ 100
METRIC RATING
328th/ 347
METRIC RANK
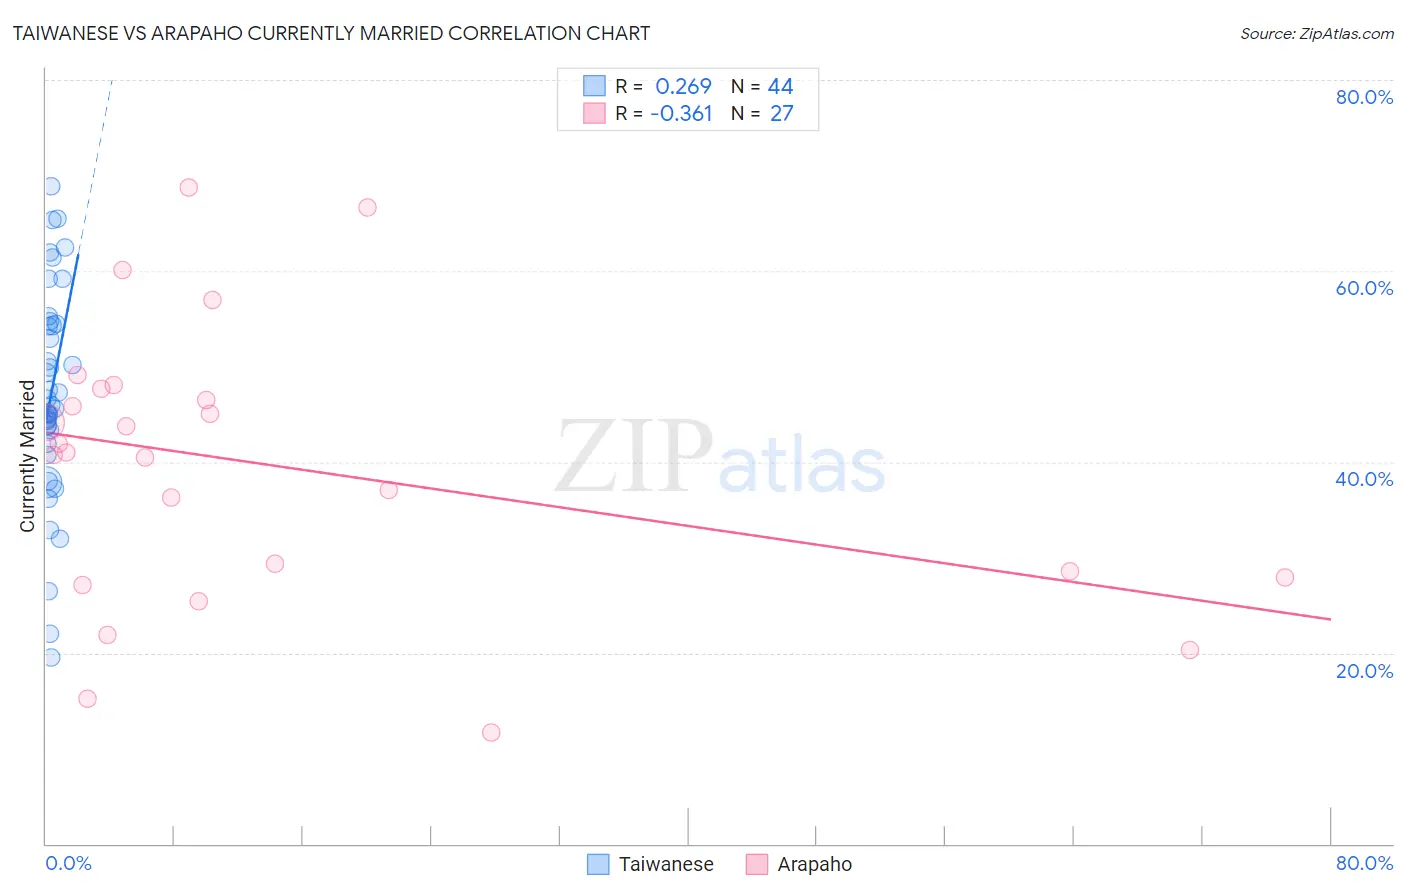
Taiwanese vs Arapaho Currently Married Correlation Chart
The statistical analysis conducted on geographies consisting of 31,720,118 people shows a weak positive correlation between the proportion of Taiwanese and percentage of population currently married in the United States with a correlation coefficient (R) of 0.269 and weighted average of 45.8%. Similarly, the statistical analysis conducted on geographies consisting of 29,779,567 people shows a mild negative correlation between the proportion of Arapaho and percentage of population currently married in the United States with a correlation coefficient (R) of -0.361 and weighted average of 40.5%, a difference of 12.9%.
Currently Married Correlation Summary
| Measurement | Taiwanese | Arapaho |
| Minimum | 19.5% | 11.7% |
| Maximum | 68.9% | 68.7% |
| Range | 49.4% | 57.0% |
| Mean | 47.1% | 39.5% |
| Median | 45.8% | 41.0% |
| Interquartile 25% (IQ1) | 42.6% | 27.9% |
| Interquartile 75% (IQ3) | 54.4% | 47.6% |
| Interquartile Range (IQR) | 11.8% | 19.7% |
| Standard Deviation (Sample) | 11.0% | 14.5% |
| Standard Deviation (Population) | 10.9% | 14.3% |
Similar Demographics by Currently Married
Demographics Similar to Taiwanese by Currently Married
In terms of currently married, the demographic groups most similar to Taiwanese are Immigrants from Spain (45.8%, a difference of 0.010%), South American Indian (45.8%, a difference of 0.020%), Immigrants (45.8%, a difference of 0.040%), Immigrants from South America (45.7%, a difference of 0.080%), and Alsatian (45.7%, a difference of 0.090%).
| Demographics | Rating | Rank | Currently Married |
| Immigrants | Bosnia and Herzegovina | 22.2 /100 | #196 | Fair 46.1% |
| Immigrants | Kuwait | 21.7 /100 | #197 | Fair 46.1% |
| Immigrants | Colombia | 21.0 /100 | #198 | Fair 46.1% |
| Immigrants | Costa Rica | 19.6 /100 | #199 | Poor 46.0% |
| Creek | 17.2 /100 | #200 | Poor 46.0% |
| Malaysians | 15.3 /100 | #201 | Poor 45.9% |
| Immigrants | Albania | 14.5 /100 | #202 | Poor 45.9% |
| Taiwanese | 11.7 /100 | #203 | Poor 45.8% |
| Immigrants | Spain | 11.6 /100 | #204 | Poor 45.8% |
| South American Indians | 11.5 /100 | #205 | Poor 45.8% |
| Immigrants | Immigrants | 11.2 /100 | #206 | Poor 45.8% |
| Immigrants | South America | 10.8 /100 | #207 | Poor 45.7% |
| Alsatians | 10.8 /100 | #208 | Poor 45.7% |
| Immigrants | Micronesia | 8.8 /100 | #209 | Tragic 45.6% |
| Uruguayans | 7.9 /100 | #210 | Tragic 45.6% |
Demographics Similar to Arapaho by Currently Married
In terms of currently married, the demographic groups most similar to Arapaho are Senegalese (40.6%, a difference of 0.040%), Barbadian (40.6%, a difference of 0.22%), U.S. Virgin Islander (40.7%, a difference of 0.35%), Immigrants from Senegal (40.7%, a difference of 0.40%), and Immigrants from West Indies (40.7%, a difference of 0.41%).
| Demographics | Rating | Rank | Currently Married |
| Immigrants | Congo | 0.0 /100 | #321 | Tragic 41.1% |
| Immigrants | Haiti | 0.0 /100 | #322 | Tragic 41.0% |
| Immigrants | West Indies | 0.0 /100 | #323 | Tragic 40.7% |
| Immigrants | Senegal | 0.0 /100 | #324 | Tragic 40.7% |
| U.S. Virgin Islanders | 0.0 /100 | #325 | Tragic 40.7% |
| Barbadians | 0.0 /100 | #326 | Tragic 40.6% |
| Senegalese | 0.0 /100 | #327 | Tragic 40.6% |
| Arapaho | 0.0 /100 | #328 | Tragic 40.5% |
| Crow | 0.0 /100 | #329 | Tragic 40.4% |
| Immigrants | Dominica | 0.0 /100 | #330 | Tragic 40.3% |
| Immigrants | Barbados | 0.0 /100 | #331 | Tragic 40.3% |
| Immigrants | St. Vincent and the Grenadines | 0.0 /100 | #332 | Tragic 40.1% |
| Yup'ik | 0.0 /100 | #333 | Tragic 39.9% |
| Puerto Ricans | 0.0 /100 | #334 | Tragic 39.9% |
| Lumbee | 0.0 /100 | #335 | Tragic 39.8% |