Immigrants from South Eastern Asia vs Arapaho Currently Married
COMPARE
Immigrants from South Eastern Asia
Arapaho
Currently Married
Currently Married Comparison
Immigrants from South Eastern Asia
Arapaho
47.1%
CURRENTLY MARRIED
72.9/ 100
METRIC RATING
145th/ 347
METRIC RANK
40.5%
CURRENTLY MARRIED
0.0/ 100
METRIC RATING
328th/ 347
METRIC RANK
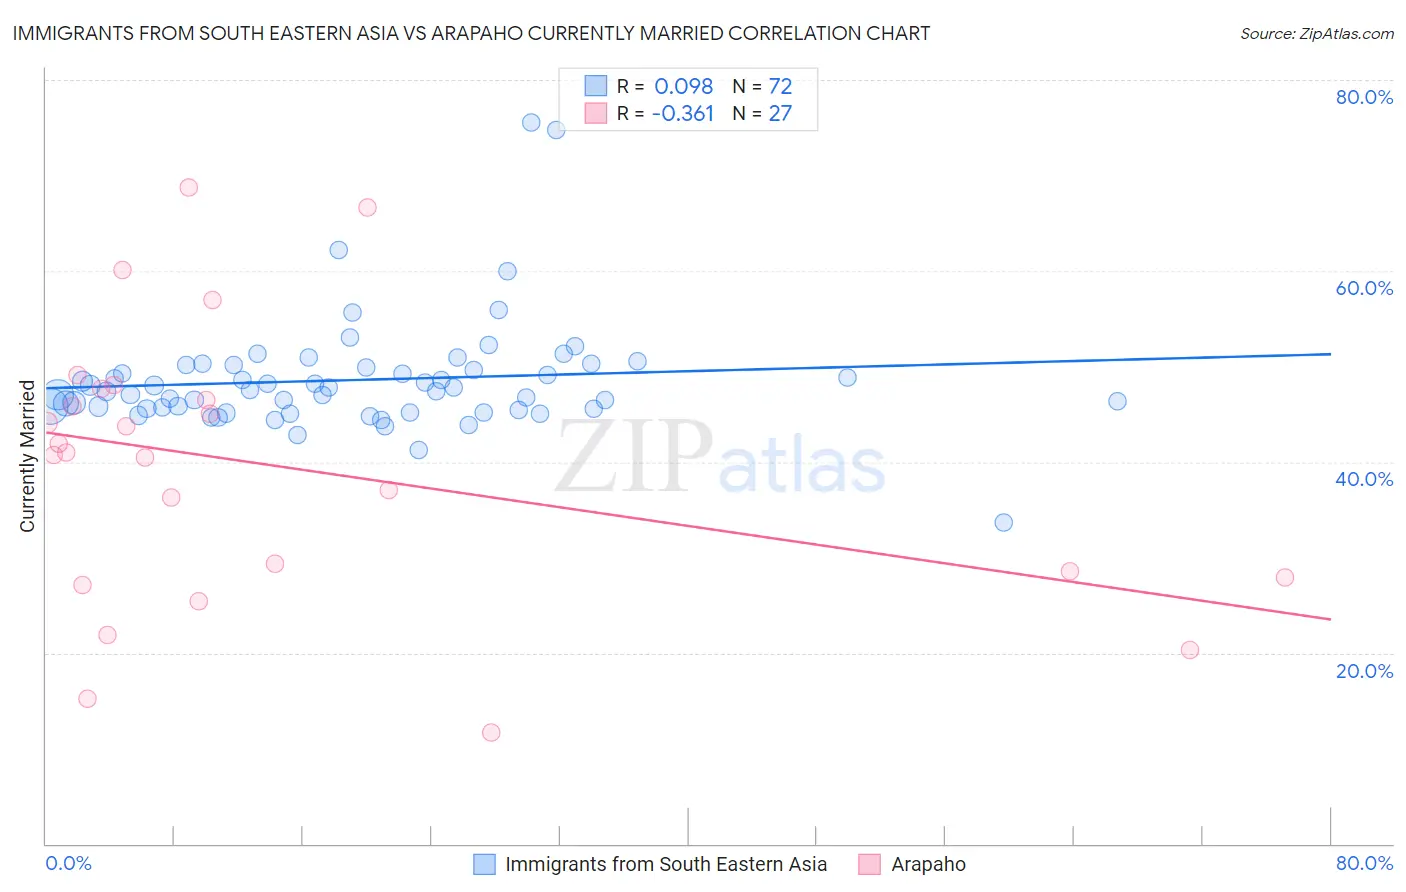
Immigrants from South Eastern Asia vs Arapaho Currently Married Correlation Chart
The statistical analysis conducted on geographies consisting of 512,635,573 people shows a slight positive correlation between the proportion of Immigrants from South Eastern Asia and percentage of population currently married in the United States with a correlation coefficient (R) of 0.098 and weighted average of 47.1%. Similarly, the statistical analysis conducted on geographies consisting of 29,779,567 people shows a mild negative correlation between the proportion of Arapaho and percentage of population currently married in the United States with a correlation coefficient (R) of -0.361 and weighted average of 40.5%, a difference of 16.1%.
Currently Married Correlation Summary
| Measurement | Immigrants from South Eastern Asia | Arapaho |
| Minimum | 33.6% | 11.7% |
| Maximum | 75.5% | 68.7% |
| Range | 41.9% | 57.0% |
| Mean | 48.6% | 39.5% |
| Median | 47.5% | 41.0% |
| Interquartile 25% (IQ1) | 45.6% | 27.9% |
| Interquartile 75% (IQ3) | 50.1% | 47.6% |
| Interquartile Range (IQR) | 4.5% | 19.7% |
| Standard Deviation (Sample) | 6.0% | 14.5% |
| Standard Deviation (Population) | 5.9% | 14.3% |
Similar Demographics by Currently Married
Demographics Similar to Immigrants from South Eastern Asia by Currently Married
In terms of currently married, the demographic groups most similar to Immigrants from South Eastern Asia are Carpatho Rusyn (47.0%, a difference of 0.010%), Hmong (47.1%, a difference of 0.030%), Immigrants from Argentina (47.0%, a difference of 0.040%), Guamanian/Chamorro (47.1%, a difference of 0.060%), and Venezuelan (47.1%, a difference of 0.070%).
| Demographics | Rating | Rank | Currently Married |
| Pakistanis | 77.5 /100 | #138 | Good 47.2% |
| Yugoslavians | 77.4 /100 | #139 | Good 47.2% |
| Cajuns | 75.3 /100 | #140 | Good 47.1% |
| Venezuelans | 74.4 /100 | #141 | Good 47.1% |
| Argentineans | 74.4 /100 | #142 | Good 47.1% |
| Guamanians/Chamorros | 74.2 /100 | #143 | Good 47.1% |
| Hmong | 73.4 /100 | #144 | Good 47.1% |
| Immigrants | South Eastern Asia | 72.9 /100 | #145 | Good 47.1% |
| Carpatho Rusyns | 72.6 /100 | #146 | Good 47.0% |
| Immigrants | Argentina | 72.0 /100 | #147 | Good 47.0% |
| Cambodians | 70.4 /100 | #148 | Good 47.0% |
| Zimbabweans | 70.1 /100 | #149 | Good 47.0% |
| Immigrants | Turkey | 70.0 /100 | #150 | Good 47.0% |
| Chileans | 69.8 /100 | #151 | Good 47.0% |
| Immigrants | Serbia | 68.8 /100 | #152 | Good 47.0% |
Demographics Similar to Arapaho by Currently Married
In terms of currently married, the demographic groups most similar to Arapaho are Senegalese (40.6%, a difference of 0.040%), Barbadian (40.6%, a difference of 0.22%), U.S. Virgin Islander (40.7%, a difference of 0.35%), Immigrants from Senegal (40.7%, a difference of 0.40%), and Immigrants from West Indies (40.7%, a difference of 0.41%).
| Demographics | Rating | Rank | Currently Married |
| Immigrants | Congo | 0.0 /100 | #321 | Tragic 41.1% |
| Immigrants | Haiti | 0.0 /100 | #322 | Tragic 41.0% |
| Immigrants | West Indies | 0.0 /100 | #323 | Tragic 40.7% |
| Immigrants | Senegal | 0.0 /100 | #324 | Tragic 40.7% |
| U.S. Virgin Islanders | 0.0 /100 | #325 | Tragic 40.7% |
| Barbadians | 0.0 /100 | #326 | Tragic 40.6% |
| Senegalese | 0.0 /100 | #327 | Tragic 40.6% |
| Arapaho | 0.0 /100 | #328 | Tragic 40.5% |
| Crow | 0.0 /100 | #329 | Tragic 40.4% |
| Immigrants | Dominica | 0.0 /100 | #330 | Tragic 40.3% |
| Immigrants | Barbados | 0.0 /100 | #331 | Tragic 40.3% |
| Immigrants | St. Vincent and the Grenadines | 0.0 /100 | #332 | Tragic 40.1% |
| Yup'ik | 0.0 /100 | #333 | Tragic 39.9% |
| Puerto Ricans | 0.0 /100 | #334 | Tragic 39.9% |
| Lumbee | 0.0 /100 | #335 | Tragic 39.8% |