American vs Paiute Currently Married
COMPARE
American
Paiute
Currently Married
Currently Married Comparison
Americans
Paiute
48.0%
CURRENTLY MARRIED
95.7/ 100
METRIC RATING
90th/ 347
METRIC RANK
42.7%
CURRENTLY MARRIED
0.0/ 100
METRIC RATING
289th/ 347
METRIC RANK
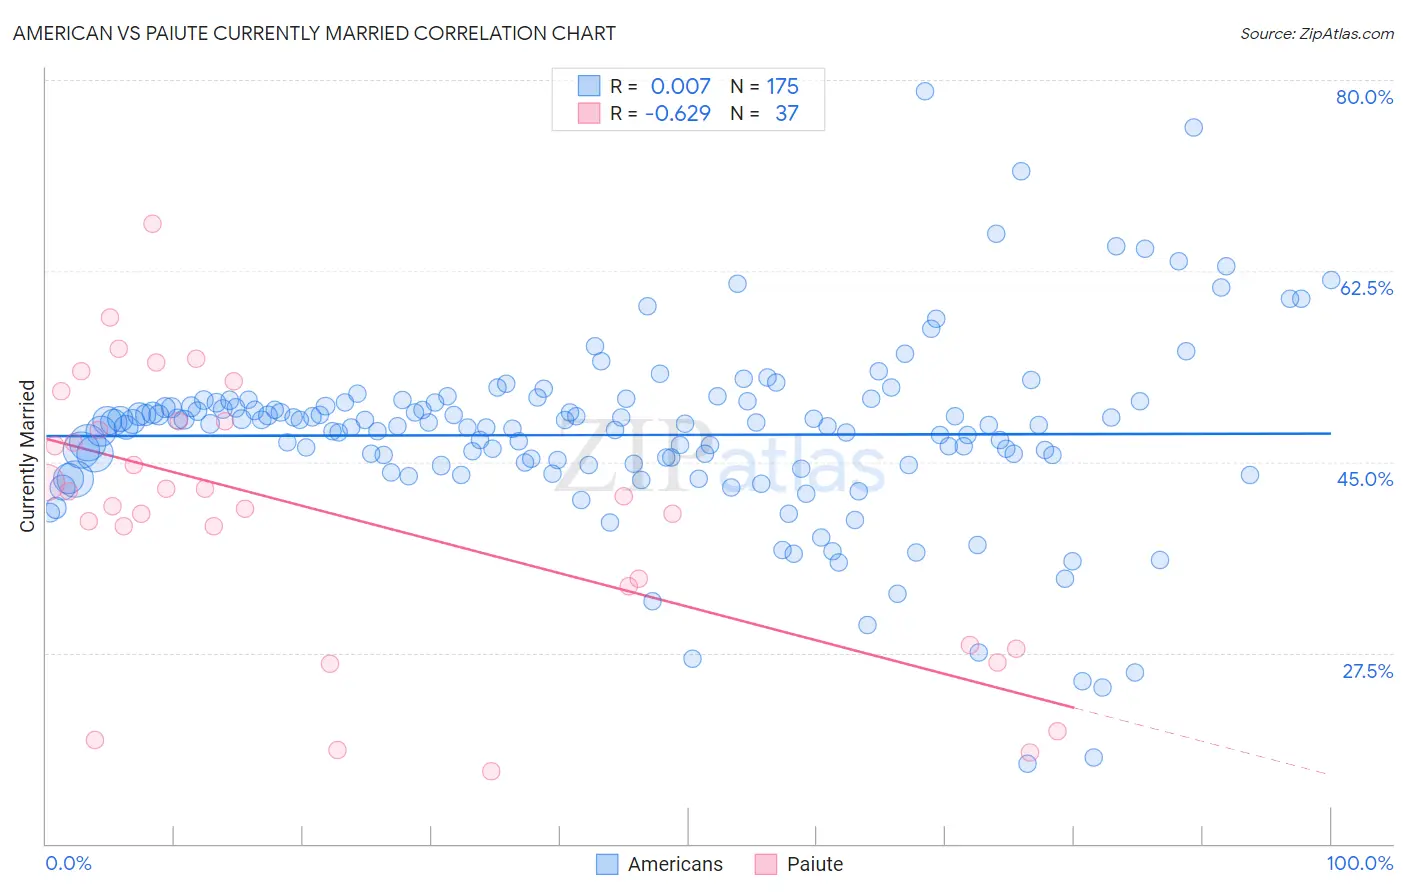
American vs Paiute Currently Married Correlation Chart
The statistical analysis conducted on geographies consisting of 581,851,049 people shows no correlation between the proportion of Americans and percentage of population currently married in the United States with a correlation coefficient (R) of 0.007 and weighted average of 48.0%. Similarly, the statistical analysis conducted on geographies consisting of 58,403,675 people shows a significant negative correlation between the proportion of Paiute and percentage of population currently married in the United States with a correlation coefficient (R) of -0.629 and weighted average of 42.7%, a difference of 12.3%.
Currently Married Correlation Summary
| Measurement | American | Paiute |
| Minimum | 17.3% | 16.6% |
| Maximum | 79.0% | 66.9% |
| Range | 61.7% | 50.3% |
| Mean | 47.5% | 40.3% |
| Median | 48.4% | 41.9% |
| Interquartile 25% (IQ1) | 44.8% | 30.9% |
| Interquartile 75% (IQ3) | 50.5% | 48.7% |
| Interquartile Range (IQR) | 5.7% | 17.8% |
| Standard Deviation (Sample) | 8.5% | 12.4% |
| Standard Deviation (Population) | 8.5% | 12.2% |
Similar Demographics by Currently Married
Demographics Similar to Americans by Currently Married
In terms of currently married, the demographic groups most similar to Americans are Indian (Asian) (48.0%, a difference of 0.020%), Immigrants from Bolivia (47.9%, a difference of 0.030%), Korean (47.9%, a difference of 0.070%), Immigrants from Eastern Europe (48.0%, a difference of 0.080%), and Jordanian (48.0%, a difference of 0.10%).
| Demographics | Rating | Rank | Currently Married |
| Bolivians | 96.9 /100 | #83 | Exceptional 48.1% |
| Immigrants | Israel | 96.9 /100 | #84 | Exceptional 48.1% |
| French Canadians | 96.3 /100 | #85 | Exceptional 48.0% |
| Immigrants | Japan | 96.2 /100 | #86 | Exceptional 48.0% |
| Jordanians | 96.2 /100 | #87 | Exceptional 48.0% |
| Immigrants | Eastern Europe | 96.1 /100 | #88 | Exceptional 48.0% |
| Indians (Asian) | 95.8 /100 | #89 | Exceptional 48.0% |
| Americans | 95.7 /100 | #90 | Exceptional 48.0% |
| Immigrants | Bolivia | 95.6 /100 | #91 | Exceptional 47.9% |
| Koreans | 95.4 /100 | #92 | Exceptional 47.9% |
| Lebanese | 95.1 /100 | #93 | Exceptional 47.9% |
| Native Hawaiians | 95.0 /100 | #94 | Exceptional 47.9% |
| Immigrants | Bulgaria | 94.8 /100 | #95 | Exceptional 47.9% |
| Egyptians | 94.8 /100 | #96 | Exceptional 47.9% |
| Immigrants | Ukraine | 94.8 /100 | #97 | Exceptional 47.9% |
Demographics Similar to Paiute by Currently Married
In terms of currently married, the demographic groups most similar to Paiute are Immigrants from Ghana (42.7%, a difference of 0.010%), Immigrants from Guatemala (42.6%, a difference of 0.12%), Native/Alaskan (42.8%, a difference of 0.23%), Subsaharan African (42.6%, a difference of 0.28%), and Yuman (42.6%, a difference of 0.30%).
| Demographics | Rating | Rank | Currently Married |
| Immigrants | Ecuador | 0.0 /100 | #282 | Tragic 43.2% |
| Kiowa | 0.0 /100 | #283 | Tragic 43.2% |
| Immigrants | El Salvador | 0.0 /100 | #284 | Tragic 43.1% |
| Immigrants | Middle Africa | 0.0 /100 | #285 | Tragic 43.0% |
| Ghanaians | 0.0 /100 | #286 | Tragic 42.9% |
| Guatemalans | 0.0 /100 | #287 | Tragic 42.9% |
| Natives/Alaskans | 0.0 /100 | #288 | Tragic 42.8% |
| Paiute | 0.0 /100 | #289 | Tragic 42.7% |
| Immigrants | Ghana | 0.0 /100 | #290 | Tragic 42.7% |
| Immigrants | Guatemala | 0.0 /100 | #291 | Tragic 42.6% |
| Sub-Saharan Africans | 0.0 /100 | #292 | Tragic 42.6% |
| Yuman | 0.0 /100 | #293 | Tragic 42.6% |
| Hondurans | 0.0 /100 | #294 | Tragic 42.5% |
| Immigrants | Western Africa | 0.0 /100 | #295 | Tragic 42.4% |
| Menominee | 0.0 /100 | #296 | Tragic 42.3% |