Potawatomi vs Cuban Currently Married
COMPARE
Potawatomi
Cuban
Currently Married
Currently Married Comparison
Potawatomi
Cubans
46.5%
CURRENTLY MARRIED
41.9/ 100
METRIC RATING
182nd/ 347
METRIC RANK
44.6%
CURRENTLY MARRIED
0.9/ 100
METRIC RATING
236th/ 347
METRIC RANK
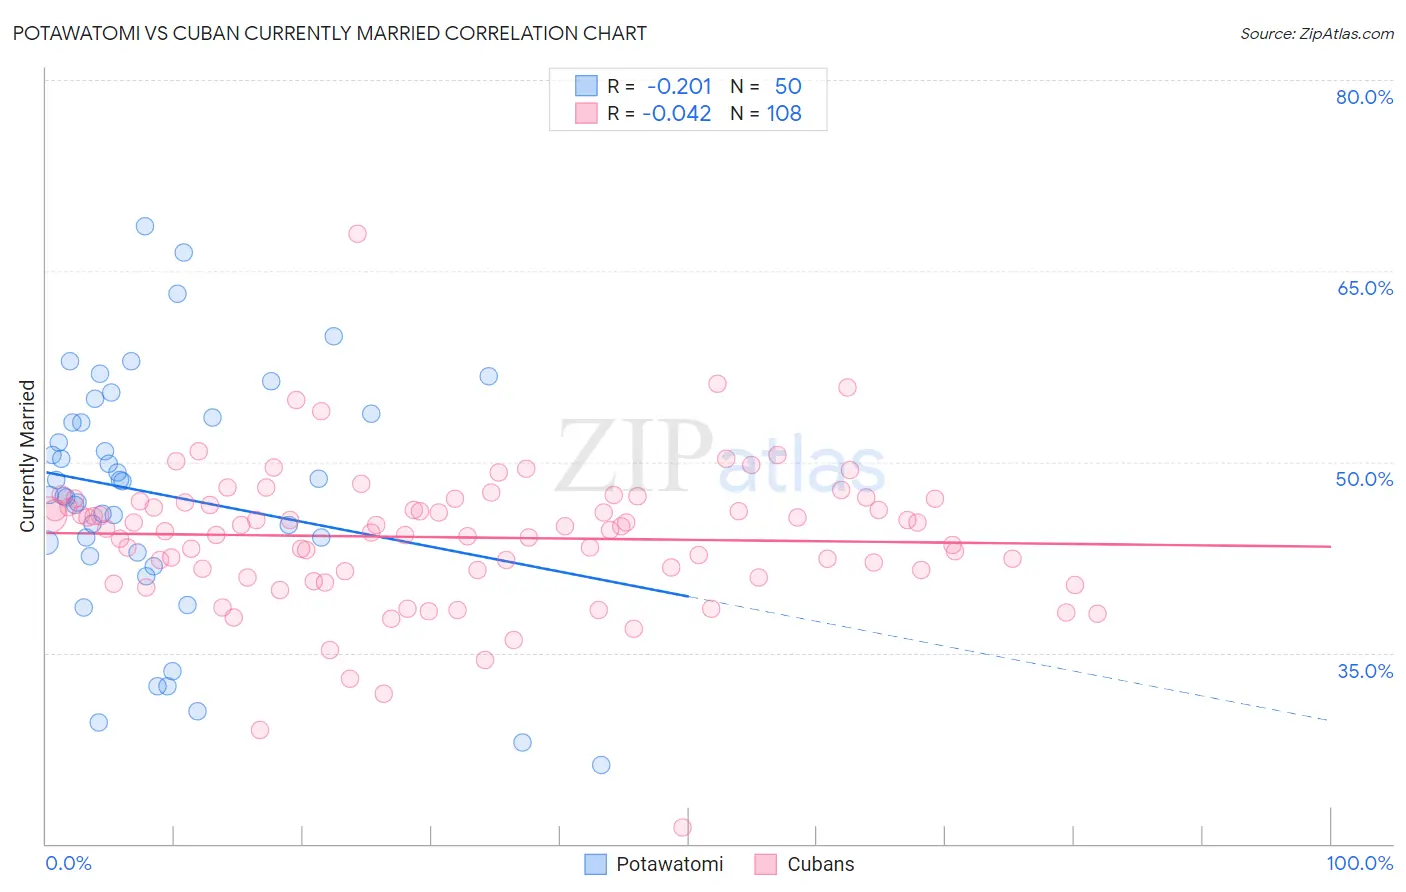
Potawatomi vs Cuban Currently Married Correlation Chart
The statistical analysis conducted on geographies consisting of 117,774,178 people shows a weak negative correlation between the proportion of Potawatomi and percentage of population currently married in the United States with a correlation coefficient (R) of -0.201 and weighted average of 46.5%. Similarly, the statistical analysis conducted on geographies consisting of 449,312,568 people shows no correlation between the proportion of Cubans and percentage of population currently married in the United States with a correlation coefficient (R) of -0.042 and weighted average of 44.6%, a difference of 4.1%.
Currently Married Correlation Summary
| Measurement | Potawatomi | Cuban |
| Minimum | 26.2% | 21.3% |
| Maximum | 68.5% | 67.9% |
| Range | 42.3% | 46.6% |
| Mean | 47.4% | 44.1% |
| Median | 48.0% | 44.8% |
| Interquartile 25% (IQ1) | 42.9% | 41.4% |
| Interquartile 75% (IQ3) | 53.5% | 46.9% |
| Interquartile Range (IQR) | 10.6% | 5.4% |
| Standard Deviation (Sample) | 9.5% | 5.7% |
| Standard Deviation (Population) | 9.4% | 5.6% |
Similar Demographics by Currently Married
Demographics Similar to Potawatomi by Currently Married
In terms of currently married, the demographic groups most similar to Potawatomi are Ottawa (46.5%, a difference of 0.040%), Costa Rican (46.5%, a difference of 0.070%), Immigrants from Northern Africa (46.5%, a difference of 0.080%), Immigrants from Oceania (46.5%, a difference of 0.10%), and Brazilian (46.4%, a difference of 0.10%).
| Demographics | Rating | Rank | Currently Married |
| Immigrants | Brazil | 49.9 /100 | #175 | Average 46.6% |
| Hawaiians | 48.6 /100 | #176 | Average 46.6% |
| Israelis | 48.6 /100 | #177 | Average 46.6% |
| Chickasaw | 47.8 /100 | #178 | Average 46.6% |
| Immigrants | Oceania | 44.6 /100 | #179 | Average 46.5% |
| Costa Ricans | 43.7 /100 | #180 | Average 46.5% |
| Ottawa | 43.0 /100 | #181 | Average 46.5% |
| Potawatomi | 41.9 /100 | #182 | Average 46.5% |
| Immigrants | Northern Africa | 39.7 /100 | #183 | Fair 46.5% |
| Brazilians | 39.3 /100 | #184 | Fair 46.4% |
| Mongolians | 37.6 /100 | #185 | Fair 46.4% |
| Immigrants | Chile | 36.8 /100 | #186 | Fair 46.4% |
| Immigrants | Peru | 35.3 /100 | #187 | Fair 46.4% |
| Colombians | 31.8 /100 | #188 | Fair 46.3% |
| Fijians | 30.3 /100 | #189 | Fair 46.3% |
Demographics Similar to Cubans by Currently Married
In terms of currently married, the demographic groups most similar to Cubans are Seminole (44.6%, a difference of 0.0%), Alaskan Athabascan (44.6%, a difference of 0.010%), Moroccan (44.6%, a difference of 0.080%), Iroquois (44.7%, a difference of 0.16%), and Immigrants from Saudi Arabia (44.7%, a difference of 0.17%).
| Demographics | Rating | Rank | Currently Married |
| Cree | 1.7 /100 | #229 | Tragic 44.9% |
| Immigrants | Kenya | 1.6 /100 | #230 | Tragic 44.9% |
| Immigrants | Panama | 1.5 /100 | #231 | Tragic 44.9% |
| Nepalese | 1.2 /100 | #232 | Tragic 44.7% |
| Immigrants | Saudi Arabia | 1.1 /100 | #233 | Tragic 44.7% |
| Iroquois | 1.1 /100 | #234 | Tragic 44.7% |
| Alaskan Athabascans | 0.9 /100 | #235 | Tragic 44.6% |
| Cubans | 0.9 /100 | #236 | Tragic 44.6% |
| Seminole | 0.9 /100 | #237 | Tragic 44.6% |
| Moroccans | 0.9 /100 | #238 | Tragic 44.6% |
| Immigrants | Mexico | 0.7 /100 | #239 | Tragic 44.5% |
| Mexican American Indians | 0.7 /100 | #240 | Tragic 44.5% |
| Ethiopians | 0.7 /100 | #241 | Tragic 44.5% |
| Immigrants | Cambodia | 0.7 /100 | #242 | Tragic 44.5% |
| Immigrants | Ethiopia | 0.7 /100 | #243 | Tragic 44.5% |