Filipino vs Cuban Currently Married
COMPARE
Filipino
Cuban
Currently Married
Currently Married Comparison
Filipinos
Cubans
49.7%
CURRENTLY MARRIED
99.9/ 100
METRIC RATING
10th/ 347
METRIC RANK
44.6%
CURRENTLY MARRIED
0.9/ 100
METRIC RATING
236th/ 347
METRIC RANK
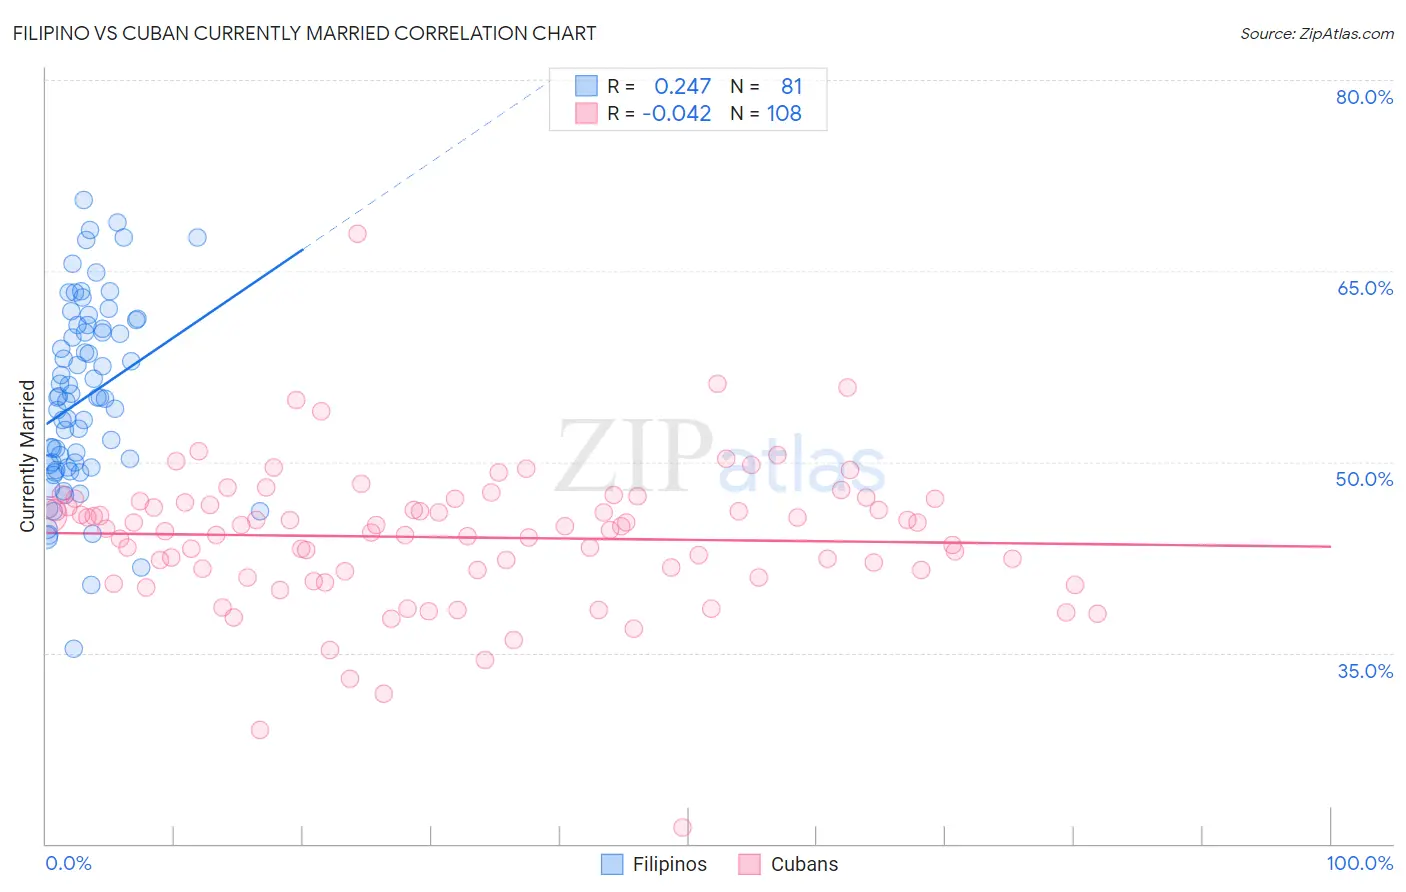
Filipino vs Cuban Currently Married Correlation Chart
The statistical analysis conducted on geographies consisting of 254,318,851 people shows a weak positive correlation between the proportion of Filipinos and percentage of population currently married in the United States with a correlation coefficient (R) of 0.247 and weighted average of 49.7%. Similarly, the statistical analysis conducted on geographies consisting of 449,312,568 people shows no correlation between the proportion of Cubans and percentage of population currently married in the United States with a correlation coefficient (R) of -0.042 and weighted average of 44.6%, a difference of 11.4%.
Currently Married Correlation Summary
| Measurement | Filipino | Cuban |
| Minimum | 35.4% | 21.3% |
| Maximum | 70.6% | 67.9% |
| Range | 35.2% | 46.6% |
| Mean | 55.0% | 44.1% |
| Median | 55.0% | 44.8% |
| Interquartile 25% (IQ1) | 49.6% | 41.4% |
| Interquartile 75% (IQ3) | 60.6% | 46.9% |
| Interquartile Range (IQR) | 11.0% | 5.4% |
| Standard Deviation (Sample) | 7.3% | 5.7% |
| Standard Deviation (Population) | 7.2% | 5.6% |
Similar Demographics by Currently Married
Demographics Similar to Filipinos by Currently Married
In terms of currently married, the demographic groups most similar to Filipinos are English (49.7%, a difference of 0.010%), Swiss (49.7%, a difference of 0.020%), Czech (49.9%, a difference of 0.26%), Dutch (49.6%, a difference of 0.28%), and German (49.6%, a difference of 0.29%).
| Demographics | Rating | Rank | Currently Married |
| Assyrians/Chaldeans/Syriacs | 100.0 /100 | #3 | Exceptional 50.8% |
| Immigrants | Taiwan | 100.0 /100 | #4 | Exceptional 50.7% |
| Danes | 100.0 /100 | #5 | Exceptional 50.5% |
| Norwegians | 100.0 /100 | #6 | Exceptional 50.2% |
| Immigrants | South Central Asia | 100.0 /100 | #7 | Exceptional 50.0% |
| Swedes | 100.0 /100 | #8 | Exceptional 50.0% |
| Czechs | 99.9 /100 | #9 | Exceptional 49.9% |
| Filipinos | 99.9 /100 | #10 | Exceptional 49.7% |
| English | 99.9 /100 | #11 | Exceptional 49.7% |
| Swiss | 99.9 /100 | #12 | Exceptional 49.7% |
| Dutch | 99.9 /100 | #13 | Exceptional 49.6% |
| Germans | 99.9 /100 | #14 | Exceptional 49.6% |
| Pennsylvania Germans | 99.9 /100 | #15 | Exceptional 49.6% |
| Chinese | 99.9 /100 | #16 | Exceptional 49.5% |
| Scandinavians | 99.9 /100 | #17 | Exceptional 49.5% |
Demographics Similar to Cubans by Currently Married
In terms of currently married, the demographic groups most similar to Cubans are Seminole (44.6%, a difference of 0.0%), Alaskan Athabascan (44.6%, a difference of 0.010%), Moroccan (44.6%, a difference of 0.080%), Iroquois (44.7%, a difference of 0.16%), and Immigrants from Saudi Arabia (44.7%, a difference of 0.17%).
| Demographics | Rating | Rank | Currently Married |
| Cree | 1.7 /100 | #229 | Tragic 44.9% |
| Immigrants | Kenya | 1.6 /100 | #230 | Tragic 44.9% |
| Immigrants | Panama | 1.5 /100 | #231 | Tragic 44.9% |
| Nepalese | 1.2 /100 | #232 | Tragic 44.7% |
| Immigrants | Saudi Arabia | 1.1 /100 | #233 | Tragic 44.7% |
| Iroquois | 1.1 /100 | #234 | Tragic 44.7% |
| Alaskan Athabascans | 0.9 /100 | #235 | Tragic 44.6% |
| Cubans | 0.9 /100 | #236 | Tragic 44.6% |
| Seminole | 0.9 /100 | #237 | Tragic 44.6% |
| Moroccans | 0.9 /100 | #238 | Tragic 44.6% |
| Immigrants | Mexico | 0.7 /100 | #239 | Tragic 44.5% |
| Mexican American Indians | 0.7 /100 | #240 | Tragic 44.5% |
| Ethiopians | 0.7 /100 | #241 | Tragic 44.5% |
| Immigrants | Cambodia | 0.7 /100 | #242 | Tragic 44.5% |
| Immigrants | Ethiopia | 0.7 /100 | #243 | Tragic 44.5% |