Italian vs Dutch West Indian Single Mother Households
COMPARE
Italian
Dutch West Indian
Single Mother Households
Single Mother Households Comparison
Italians
Dutch West Indians
5.6%
SINGLE MOTHER HOUSEHOLDS
98.5/ 100
METRIC RATING
67th/ 347
METRIC RANK
7.3%
SINGLE MOTHER HOUSEHOLDS
0.4/ 100
METRIC RATING
247th/ 347
METRIC RANK
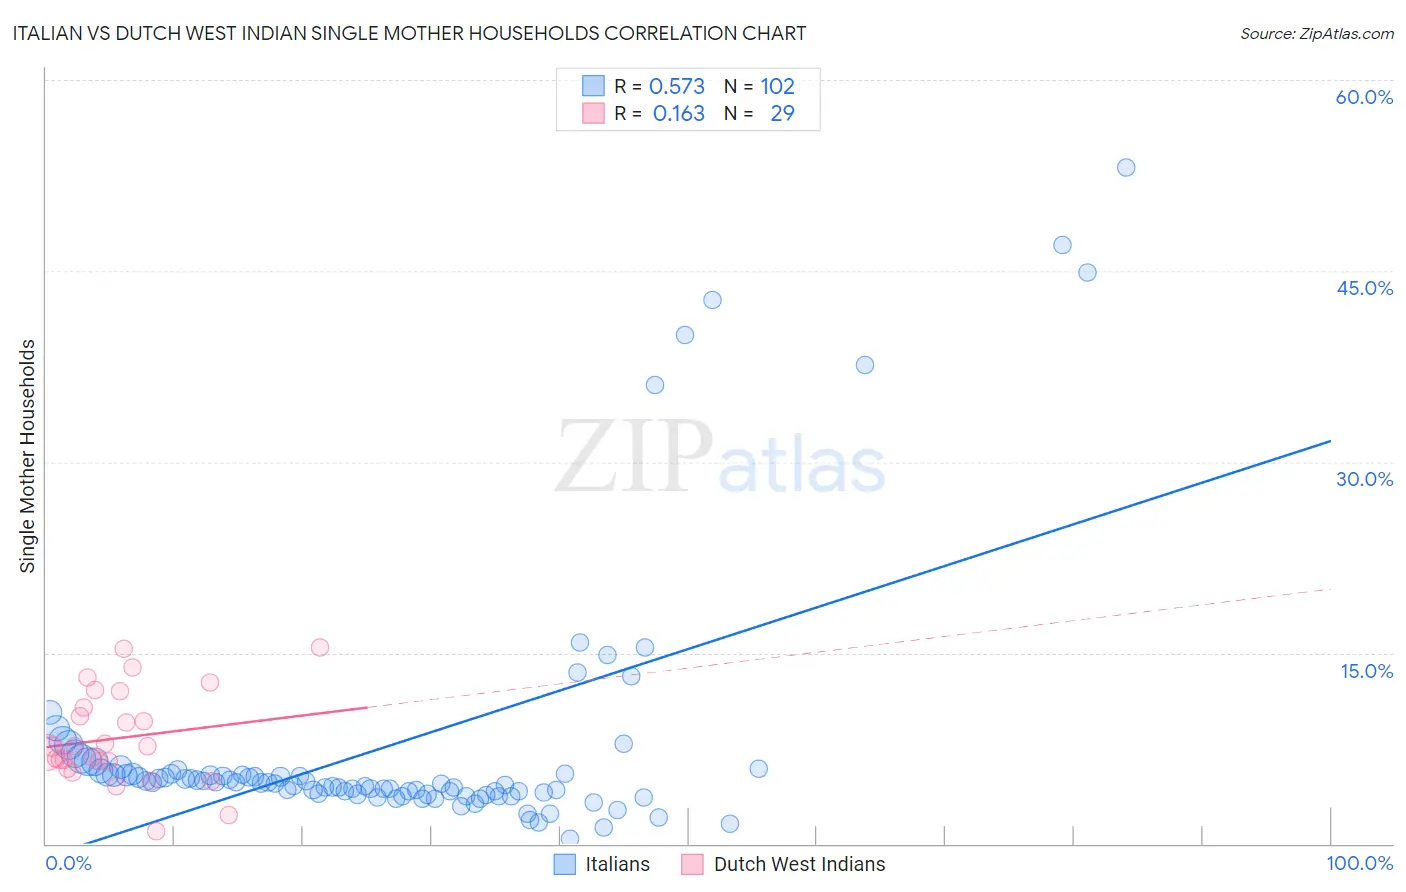
Italian vs Dutch West Indian Single Mother Households Correlation Chart
The statistical analysis conducted on geographies consisting of 569,278,543 people shows a substantial positive correlation between the proportion of Italians and percentage of single mother households in the United States with a correlation coefficient (R) of 0.573 and weighted average of 5.6%. Similarly, the statistical analysis conducted on geographies consisting of 85,708,147 people shows a poor positive correlation between the proportion of Dutch West Indians and percentage of single mother households in the United States with a correlation coefficient (R) of 0.163 and weighted average of 7.3%, a difference of 29.9%.
Single Mother Households Correlation Summary
| Measurement | Italian | Dutch West Indian |
| Minimum | 0.42% | 0.97% |
| Maximum | 53.1% | 15.4% |
| Range | 52.7% | 14.4% |
| Mean | 7.7% | 8.3% |
| Median | 4.8% | 7.6% |
| Interquartile 25% (IQ1) | 4.0% | 6.2% |
| Interquartile 75% (IQ3) | 5.5% | 11.3% |
| Interquartile Range (IQR) | 1.6% | 5.2% |
| Standard Deviation (Sample) | 10.1% | 3.6% |
| Standard Deviation (Population) | 10.0% | 3.6% |
Similar Demographics by Single Mother Households
Demographics Similar to Italians by Single Mother Households
In terms of single mother households, the demographic groups most similar to Italians are Immigrants from Canada (5.6%, a difference of 0.020%), Immigrants from Bulgaria (5.6%, a difference of 0.070%), Asian (5.6%, a difference of 0.090%), Greek (5.6%, a difference of 0.12%), and Immigrants from France (5.6%, a difference of 0.16%).
| Demographics | Rating | Rank | Single Mother Households |
| Immigrants | Norway | 98.7 /100 | #60 | Exceptional 5.6% |
| Australians | 98.7 /100 | #61 | Exceptional 5.6% |
| Poles | 98.6 /100 | #62 | Exceptional 5.6% |
| Immigrants | North Macedonia | 98.6 /100 | #63 | Exceptional 5.6% |
| Immigrants | France | 98.6 /100 | #64 | Exceptional 5.6% |
| Greeks | 98.6 /100 | #65 | Exceptional 5.6% |
| Immigrants | Canada | 98.5 /100 | #66 | Exceptional 5.6% |
| Italians | 98.5 /100 | #67 | Exceptional 5.6% |
| Immigrants | Bulgaria | 98.5 /100 | #68 | Exceptional 5.6% |
| Asians | 98.5 /100 | #69 | Exceptional 5.6% |
| Immigrants | Eastern Europe | 98.4 /100 | #70 | Exceptional 5.6% |
| Immigrants | Kazakhstan | 98.4 /100 | #71 | Exceptional 5.6% |
| Immigrants | Netherlands | 98.4 /100 | #72 | Exceptional 5.6% |
| Immigrants | Asia | 98.4 /100 | #73 | Exceptional 5.6% |
| Immigrants | North America | 98.3 /100 | #74 | Exceptional 5.6% |
Demographics Similar to Dutch West Indians by Single Mother Households
In terms of single mother households, the demographic groups most similar to Dutch West Indians are Spanish American Indian (7.3%, a difference of 0.030%), Nicaraguan (7.2%, a difference of 0.25%), Bermudan (7.3%, a difference of 0.32%), Immigrants from Africa (7.3%, a difference of 0.33%), and Immigrants from Cambodia (7.2%, a difference of 0.43%).
| Demographics | Rating | Rank | Single Mother Households |
| Immigrants | Panama | 0.7 /100 | #240 | Tragic 7.2% |
| Immigrants | Portugal | 0.6 /100 | #241 | Tragic 7.2% |
| Fijians | 0.6 /100 | #242 | Tragic 7.2% |
| Ecuadorians | 0.6 /100 | #243 | Tragic 7.2% |
| Cubans | 0.6 /100 | #244 | Tragic 7.2% |
| Immigrants | Cambodia | 0.5 /100 | #245 | Tragic 7.2% |
| Nicaraguans | 0.5 /100 | #246 | Tragic 7.2% |
| Dutch West Indians | 0.4 /100 | #247 | Tragic 7.3% |
| Spanish American Indians | 0.4 /100 | #248 | Tragic 7.3% |
| Bermudans | 0.4 /100 | #249 | Tragic 7.3% |
| Immigrants | Africa | 0.4 /100 | #250 | Tragic 7.3% |
| Malaysians | 0.3 /100 | #251 | Tragic 7.3% |
| Alaskan Athabascans | 0.3 /100 | #252 | Tragic 7.3% |
| Cajuns | 0.3 /100 | #253 | Tragic 7.3% |
| Immigrants | Ecuador | 0.3 /100 | #254 | Tragic 7.3% |