Albanian vs Immigrants from Romania Births to Unmarried Women
COMPARE
Albanian
Immigrants from Romania
Births to Unmarried Women
Births to Unmarried Women Comparison
Albanians
Immigrants from Romania
28.5%
BIRTHS TO UNMARRIED WOMEN
98.5/ 100
METRIC RATING
73rd/ 347
METRIC RANK
27.9%
BIRTHS TO UNMARRIED WOMEN
99.4/ 100
METRIC RATING
53rd/ 347
METRIC RANK
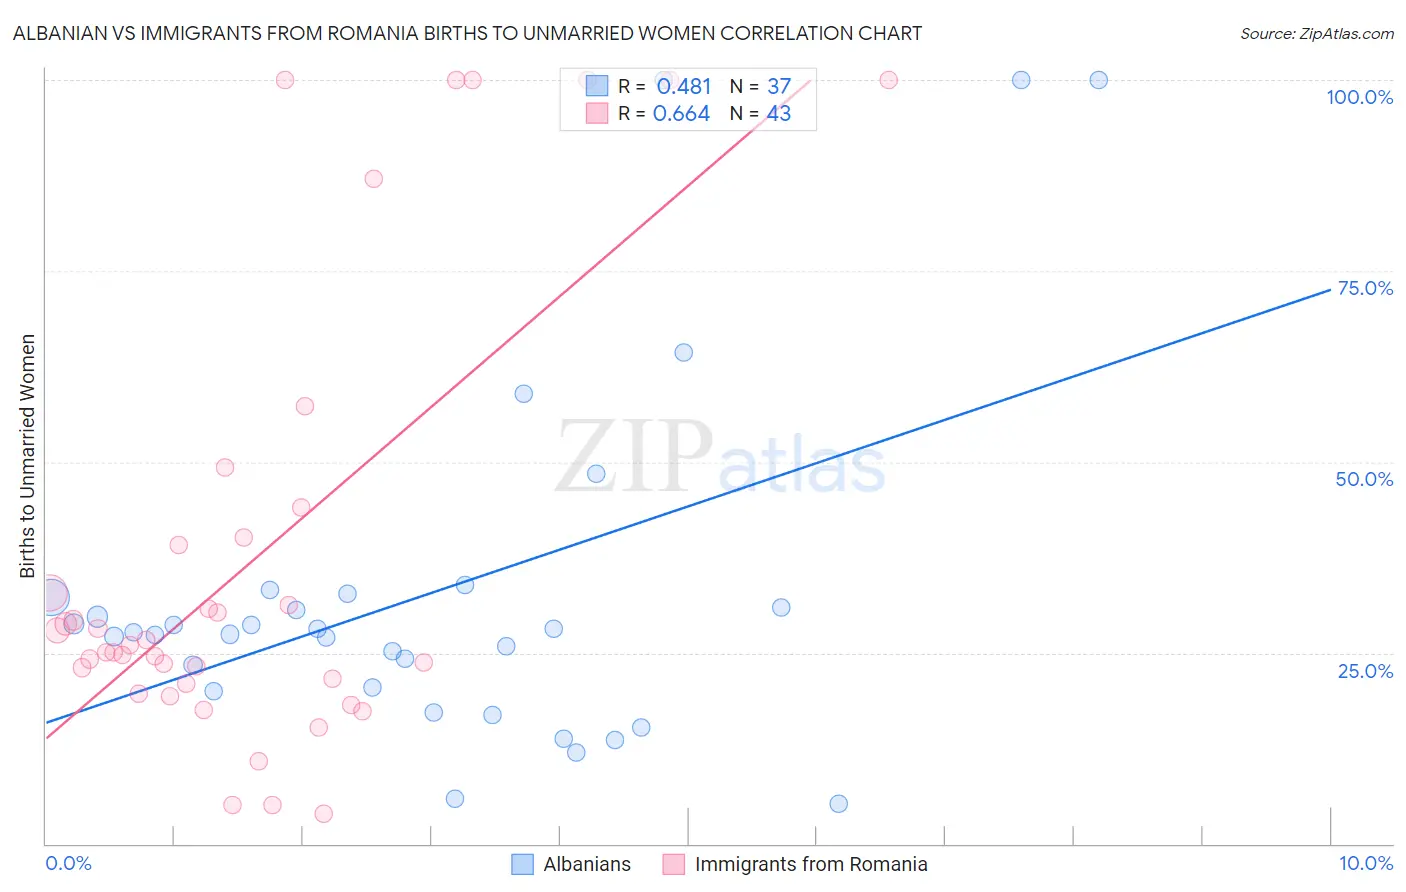
Albanian vs Immigrants from Romania Births to Unmarried Women Correlation Chart
The statistical analysis conducted on geographies consisting of 182,909,720 people shows a moderate positive correlation between the proportion of Albanians and percentage of births to unmarried women in the United States with a correlation coefficient (R) of 0.481 and weighted average of 28.5%. Similarly, the statistical analysis conducted on geographies consisting of 242,549,897 people shows a significant positive correlation between the proportion of Immigrants from Romania and percentage of births to unmarried women in the United States with a correlation coefficient (R) of 0.664 and weighted average of 27.9%, a difference of 2.4%.
Births to Unmarried Women Correlation Summary
| Measurement | Albanian | Immigrants from Romania |
| Minimum | 5.2% | 3.9% |
| Maximum | 100.0% | 100.0% |
| Range | 94.8% | 96.1% |
| Mean | 32.8% | 37.2% |
| Median | 27.7% | 26.1% |
| Interquartile 25% (IQ1) | 20.2% | 21.0% |
| Interquartile 75% (IQ3) | 32.5% | 40.2% |
| Interquartile Range (IQR) | 12.3% | 19.2% |
| Standard Deviation (Sample) | 23.4% | 29.1% |
| Standard Deviation (Population) | 23.1% | 28.8% |
Demographics Similar to Albanians and Immigrants from Romania by Births to Unmarried Women
In terms of births to unmarried women, the demographic groups most similar to Albanians are Immigrants from Sweden (28.5%, a difference of 0.050%), Jordanian (28.5%, a difference of 0.11%), Laotian (28.5%, a difference of 0.29%), Bolivian (28.5%, a difference of 0.34%), and Immigrants from Europe (28.4%, a difference of 0.38%). Similarly, the demographic groups most similar to Immigrants from Romania are Afghan (27.9%, a difference of 0.070%), Mongolian (27.9%, a difference of 0.11%), Immigrants from Belgium (28.0%, a difference of 0.37%), Russian (28.0%, a difference of 0.50%), and Immigrants from Albania (28.0%, a difference of 0.61%).
| Demographics | Rating | Rank | Births to Unmarried Women |
| Immigrants | Romania | 99.4 /100 | #53 | Exceptional 27.9% |
| Afghans | 99.4 /100 | #54 | Exceptional 27.9% |
| Mongolians | 99.3 /100 | #55 | Exceptional 27.9% |
| Immigrants | Belgium | 99.3 /100 | #56 | Exceptional 28.0% |
| Russians | 99.2 /100 | #57 | Exceptional 28.0% |
| Immigrants | Albania | 99.2 /100 | #58 | Exceptional 28.0% |
| Immigrants | Kazakhstan | 99.1 /100 | #59 | Exceptional 28.1% |
| Immigrants | Turkey | 99.1 /100 | #60 | Exceptional 28.1% |
| Immigrants | North Macedonia | 99.1 /100 | #61 | Exceptional 28.1% |
| Egyptians | 99.0 /100 | #62 | Exceptional 28.2% |
| Immigrants | Serbia | 98.9 /100 | #63 | Exceptional 28.3% |
| Tongans | 98.8 /100 | #64 | Exceptional 28.4% |
| Immigrants | Czechoslovakia | 98.8 /100 | #65 | Exceptional 28.4% |
| Immigrants | Egypt | 98.8 /100 | #66 | Exceptional 28.4% |
| Palestinians | 98.7 /100 | #67 | Exceptional 28.4% |
| Immigrants | Europe | 98.7 /100 | #68 | Exceptional 28.4% |
| Bolivians | 98.7 /100 | #69 | Exceptional 28.5% |
| Laotians | 98.6 /100 | #70 | Exceptional 28.5% |
| Jordanians | 98.5 /100 | #71 | Exceptional 28.5% |
| Immigrants | Sweden | 98.5 /100 | #72 | Exceptional 28.5% |
| Albanians | 98.5 /100 | #73 | Exceptional 28.5% |