Albanian vs English Births to Unmarried Women
COMPARE
Albanian
English
Births to Unmarried Women
Births to Unmarried Women Comparison
Albanians
English
28.5%
BIRTHS TO UNMARRIED WOMEN
98.5/ 100
METRIC RATING
73rd/ 347
METRIC RANK
31.7%
BIRTHS TO UNMARRIED WOMEN
47.4/ 100
METRIC RATING
178th/ 347
METRIC RANK
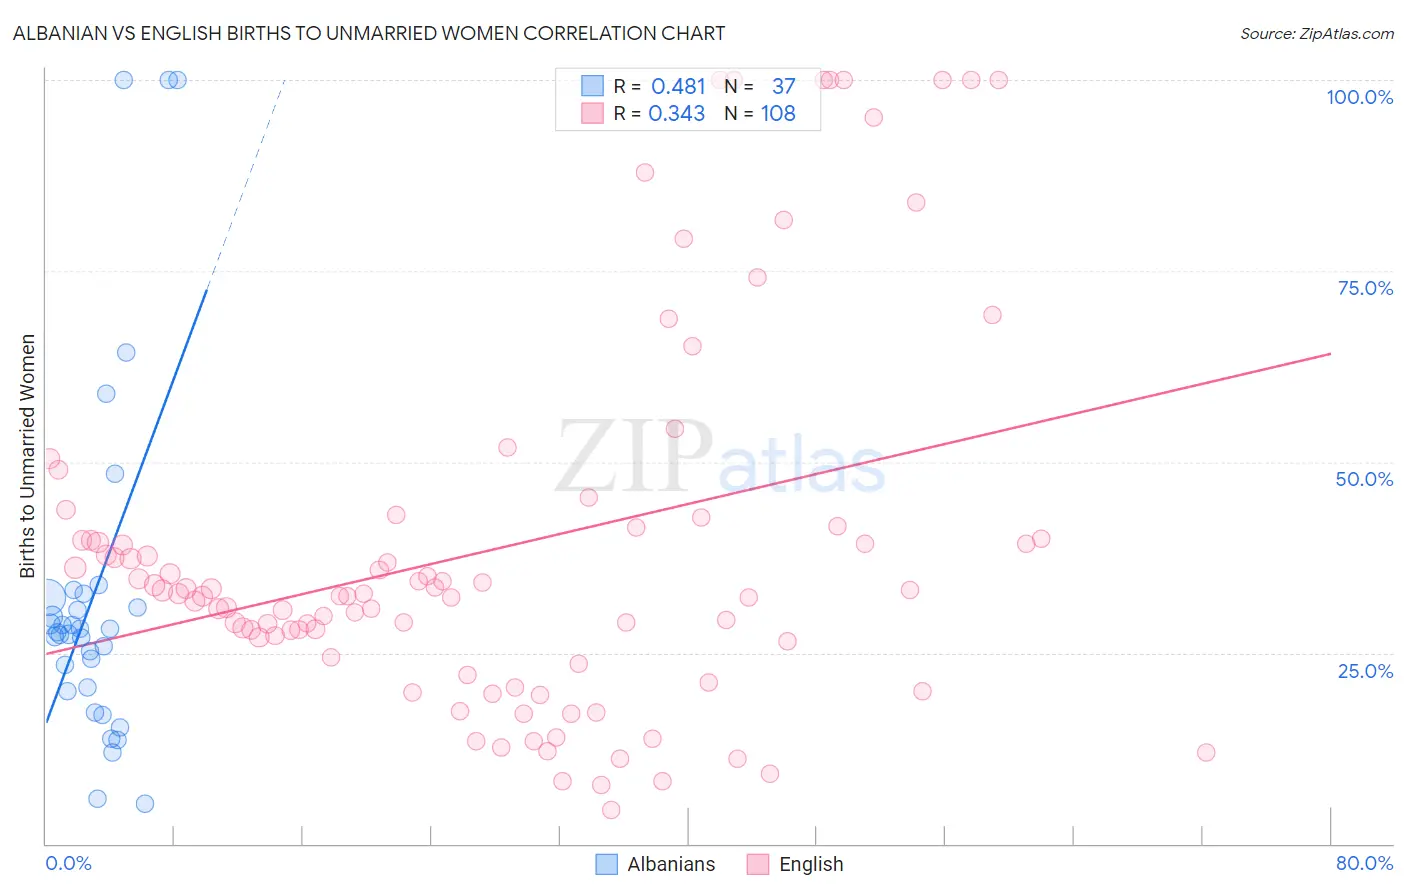
Albanian vs English Births to Unmarried Women Correlation Chart
The statistical analysis conducted on geographies consisting of 182,909,720 people shows a moderate positive correlation between the proportion of Albanians and percentage of births to unmarried women in the United States with a correlation coefficient (R) of 0.481 and weighted average of 28.5%. Similarly, the statistical analysis conducted on geographies consisting of 509,798,956 people shows a mild positive correlation between the proportion of English and percentage of births to unmarried women in the United States with a correlation coefficient (R) of 0.343 and weighted average of 31.7%, a difference of 11.2%.
Births to Unmarried Women Correlation Summary
| Measurement | Albanian | English |
| Minimum | 5.2% | 4.5% |
| Maximum | 100.0% | 100.0% |
| Range | 94.8% | 95.5% |
| Mean | 32.8% | 38.5% |
| Median | 27.7% | 32.8% |
| Interquartile 25% (IQ1) | 20.2% | 25.5% |
| Interquartile 75% (IQ3) | 32.5% | 40.7% |
| Interquartile Range (IQR) | 12.3% | 15.2% |
| Standard Deviation (Sample) | 23.4% | 24.5% |
| Standard Deviation (Population) | 23.1% | 24.3% |
Similar Demographics by Births to Unmarried Women
Demographics Similar to Albanians by Births to Unmarried Women
In terms of births to unmarried women, the demographic groups most similar to Albanians are Immigrants from Bolivia (28.6%, a difference of 0.020%), Immigrants from Sweden (28.5%, a difference of 0.050%), Jordanian (28.5%, a difference of 0.11%), Immigrants from Switzerland (28.6%, a difference of 0.11%), and Israeli (28.6%, a difference of 0.13%).
| Demographics | Rating | Rank | Births to Unmarried Women |
| Immigrants | Egypt | 98.8 /100 | #66 | Exceptional 28.4% |
| Palestinians | 98.7 /100 | #67 | Exceptional 28.4% |
| Immigrants | Europe | 98.7 /100 | #68 | Exceptional 28.4% |
| Bolivians | 98.7 /100 | #69 | Exceptional 28.5% |
| Laotians | 98.6 /100 | #70 | Exceptional 28.5% |
| Jordanians | 98.5 /100 | #71 | Exceptional 28.5% |
| Immigrants | Sweden | 98.5 /100 | #72 | Exceptional 28.5% |
| Albanians | 98.5 /100 | #73 | Exceptional 28.5% |
| Immigrants | Bolivia | 98.5 /100 | #74 | Exceptional 28.6% |
| Immigrants | Switzerland | 98.4 /100 | #75 | Exceptional 28.6% |
| Israelis | 98.4 /100 | #76 | Exceptional 28.6% |
| Immigrants | Northern Europe | 98.3 /100 | #77 | Exceptional 28.6% |
| Zimbabweans | 98.2 /100 | #78 | Exceptional 28.7% |
| Danes | 98.2 /100 | #79 | Exceptional 28.7% |
| Immigrants | Afghanistan | 98.1 /100 | #80 | Exceptional 28.7% |
Demographics Similar to English by Births to Unmarried Women
In terms of births to unmarried women, the demographic groups most similar to English are South American Indian (31.7%, a difference of 0.030%), South American (31.8%, a difference of 0.040%), Scottish (31.7%, a difference of 0.070%), Moroccan (31.8%, a difference of 0.15%), and Immigrants from Venezuela (31.7%, a difference of 0.17%).
| Demographics | Rating | Rank | Births to Unmarried Women |
| Finns | 50.5 /100 | #171 | Average 31.7% |
| Immigrants | Eritrea | 50.4 /100 | #172 | Average 31.7% |
| Immigrants | Yemen | 50.2 /100 | #173 | Average 31.7% |
| Venezuelans | 50.0 /100 | #174 | Average 31.7% |
| Immigrants | Venezuela | 49.2 /100 | #175 | Average 31.7% |
| Scottish | 48.1 /100 | #176 | Average 31.7% |
| South American Indians | 47.7 /100 | #177 | Average 31.7% |
| English | 47.4 /100 | #178 | Average 31.7% |
| South Americans | 46.9 /100 | #179 | Average 31.8% |
| Moroccans | 45.7 /100 | #180 | Average 31.8% |
| Immigrants | Peru | 45.1 /100 | #181 | Average 31.8% |
| Kenyans | 43.0 /100 | #182 | Average 31.9% |
| Canadians | 41.4 /100 | #183 | Average 31.9% |
| Immigrants | South America | 40.7 /100 | #184 | Average 32.0% |
| Germans | 39.5 /100 | #185 | Fair 32.0% |