Alaska Native vs Immigrants from Bangladesh Unemployment Among Women with Children Ages 6 to 17 years
COMPARE
Alaska Native
Immigrants from Bangladesh
Unemployment Among Women with Children Ages 6 to 17 years
Unemployment Among Women with Children Ages 6 to 17 years Comparison
Alaska Natives
Immigrants from Bangladesh
10.3%
UNEMPLOYMENT AMONG WOMEN WITH CHILDREN AGES 6 TO 17 YEARS
0.0/ 100
METRIC RATING
310th/ 347
METRIC RANK
8.8%
UNEMPLOYMENT AMONG WOMEN WITH CHILDREN AGES 6 TO 17 YEARS
79.4/ 100
METRIC RATING
147th/ 347
METRIC RANK
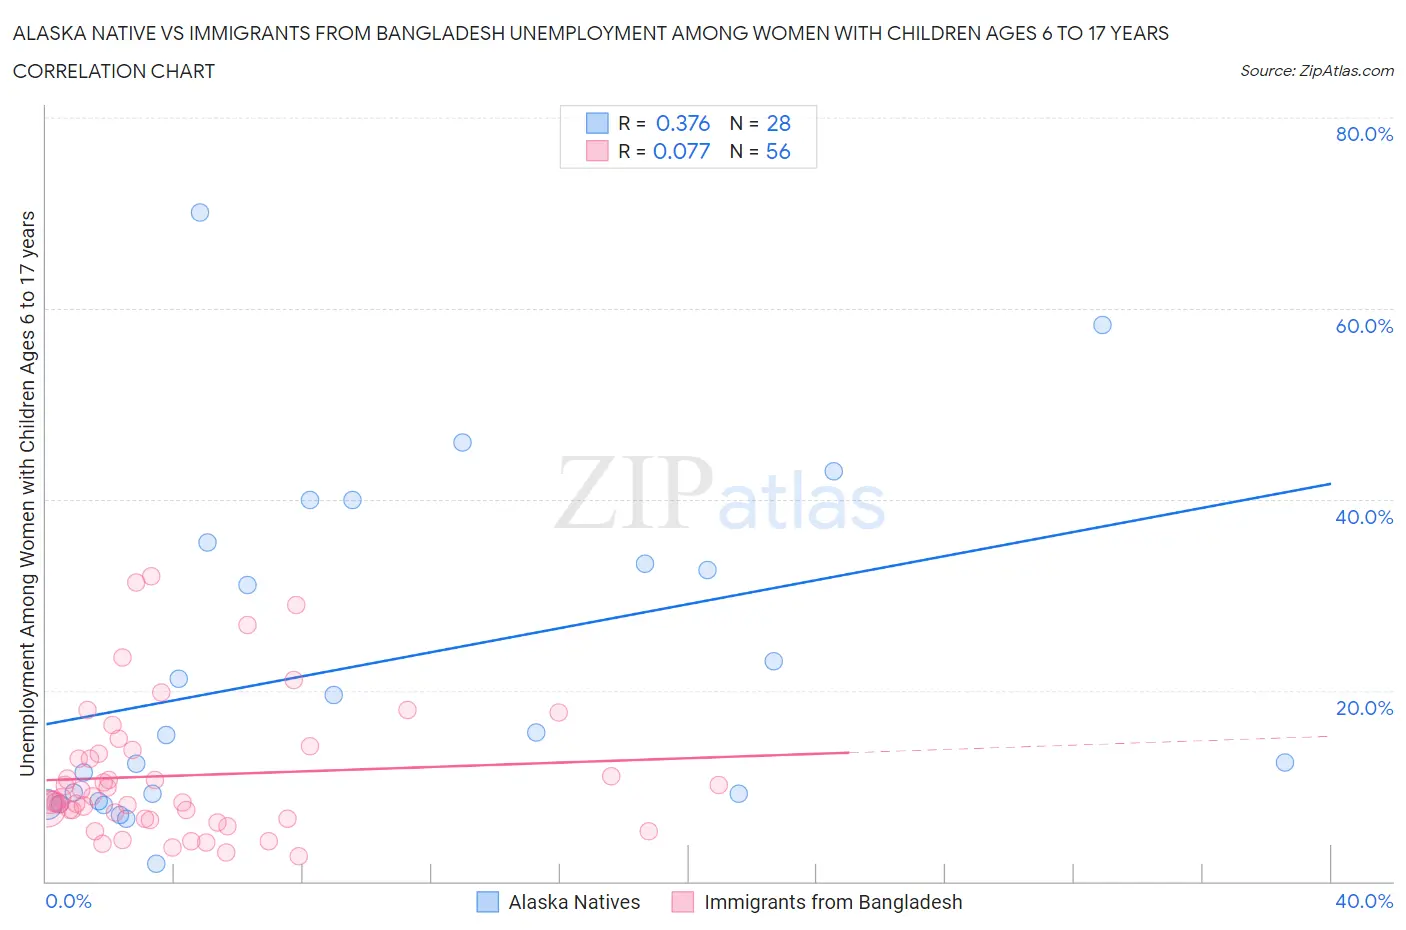
Alaska Native vs Immigrants from Bangladesh Unemployment Among Women with Children Ages 6 to 17 years Correlation Chart
The statistical analysis conducted on geographies consisting of 69,081,648 people shows a mild positive correlation between the proportion of Alaska Natives and unemployment rate among women with children between the ages 6 and 17 in the United States with a correlation coefficient (R) of 0.376 and weighted average of 10.3%. Similarly, the statistical analysis conducted on geographies consisting of 168,151,292 people shows a slight positive correlation between the proportion of Immigrants from Bangladesh and unemployment rate among women with children between the ages 6 and 17 in the United States with a correlation coefficient (R) of 0.077 and weighted average of 8.8%, a difference of 16.7%.
Unemployment Among Women with Children Ages 6 to 17 years Correlation Summary
| Measurement | Alaska Native | Immigrants from Bangladesh |
| Minimum | 1.9% | 2.6% |
| Maximum | 70.0% | 31.9% |
| Range | 68.1% | 29.3% |
| Mean | 22.7% | 11.1% |
| Median | 15.4% | 8.6% |
| Interquartile 25% (IQ1) | 8.8% | 6.6% |
| Interquartile 75% (IQ3) | 34.4% | 13.6% |
| Interquartile Range (IQR) | 25.6% | 7.1% |
| Standard Deviation (Sample) | 17.5% | 7.0% |
| Standard Deviation (Population) | 17.2% | 7.0% |
Similar Demographics by Unemployment Among Women with Children Ages 6 to 17 years
Demographics Similar to Alaska Natives by Unemployment Among Women with Children Ages 6 to 17 years
In terms of unemployment among women with children ages 6 to 17 years, the demographic groups most similar to Alaska Natives are Immigrants from Liberia (10.3%, a difference of 0.030%), French Canadian (10.3%, a difference of 0.050%), Dutch West Indian (10.2%, a difference of 0.59%), Immigrants from Senegal (10.2%, a difference of 0.61%), and Paraguayan (10.2%, a difference of 0.84%).
| Demographics | Rating | Rank | Unemployment Among Women with Children Ages 6 to 17 years |
| Immigrants | Ecuador | 0.0 /100 | #303 | Tragic 10.2% |
| Immigrants | Venezuela | 0.0 /100 | #304 | Tragic 10.2% |
| Immigrants | Nigeria | 0.0 /100 | #305 | Tragic 10.2% |
| Paraguayans | 0.0 /100 | #306 | Tragic 10.2% |
| Immigrants | Senegal | 0.0 /100 | #307 | Tragic 10.2% |
| Dutch West Indians | 0.0 /100 | #308 | Tragic 10.2% |
| French Canadians | 0.0 /100 | #309 | Tragic 10.3% |
| Alaska Natives | 0.0 /100 | #310 | Tragic 10.3% |
| Immigrants | Liberia | 0.0 /100 | #311 | Tragic 10.3% |
| Africans | 0.0 /100 | #312 | Tragic 10.4% |
| Americans | 0.0 /100 | #313 | Tragic 10.4% |
| Immigrants | Cabo Verde | 0.0 /100 | #314 | Tragic 10.4% |
| Bahamians | 0.0 /100 | #315 | Tragic 10.4% |
| Immigrants | Dominica | 0.0 /100 | #316 | Tragic 10.5% |
| Bermudans | 0.0 /100 | #317 | Tragic 10.5% |
Demographics Similar to Immigrants from Bangladesh by Unemployment Among Women with Children Ages 6 to 17 years
In terms of unemployment among women with children ages 6 to 17 years, the demographic groups most similar to Immigrants from Bangladesh are Chilean (8.8%, a difference of 0.10%), Costa Rican (8.8%, a difference of 0.16%), Croatian (8.8%, a difference of 0.22%), Greek (8.9%, a difference of 0.27%), and Immigrants from Eastern Africa (8.9%, a difference of 0.31%).
| Demographics | Rating | Rank | Unemployment Among Women with Children Ages 6 to 17 years |
| Immigrants | Poland | 88.3 /100 | #140 | Excellent 8.8% |
| Serbians | 87.6 /100 | #141 | Excellent 8.8% |
| Immigrants | Austria | 87.5 /100 | #142 | Excellent 8.8% |
| Immigrants | Kenya | 86.1 /100 | #143 | Excellent 8.8% |
| Russians | 85.8 /100 | #144 | Excellent 8.8% |
| Kenyans | 85.6 /100 | #145 | Excellent 8.8% |
| Chileans | 80.8 /100 | #146 | Excellent 8.8% |
| Immigrants | Bangladesh | 79.4 /100 | #147 | Good 8.8% |
| Costa Ricans | 77.0 /100 | #148 | Good 8.8% |
| Croatians | 76.0 /100 | #149 | Good 8.8% |
| Greeks | 75.2 /100 | #150 | Good 8.9% |
| Immigrants | Eastern Africa | 74.6 /100 | #151 | Good 8.9% |
| Immigrants | Northern Europe | 74.6 /100 | #152 | Good 8.9% |
| Immigrants | Europe | 73.4 /100 | #153 | Good 8.9% |
| Vietnamese | 72.1 /100 | #154 | Good 8.9% |