African vs Spaniard Married-couple Households
COMPARE
African
Spaniard
Married-couple Households
Married-couple Households Comparison
Africans
Spaniards
40.9%
MARRIED-COUPLE HOUSEHOLDS
0.0/ 100
METRIC RATING
312th/ 347
METRIC RANK
47.2%
MARRIED-COUPLE HOUSEHOLDS
84.1/ 100
METRIC RATING
142nd/ 347
METRIC RANK
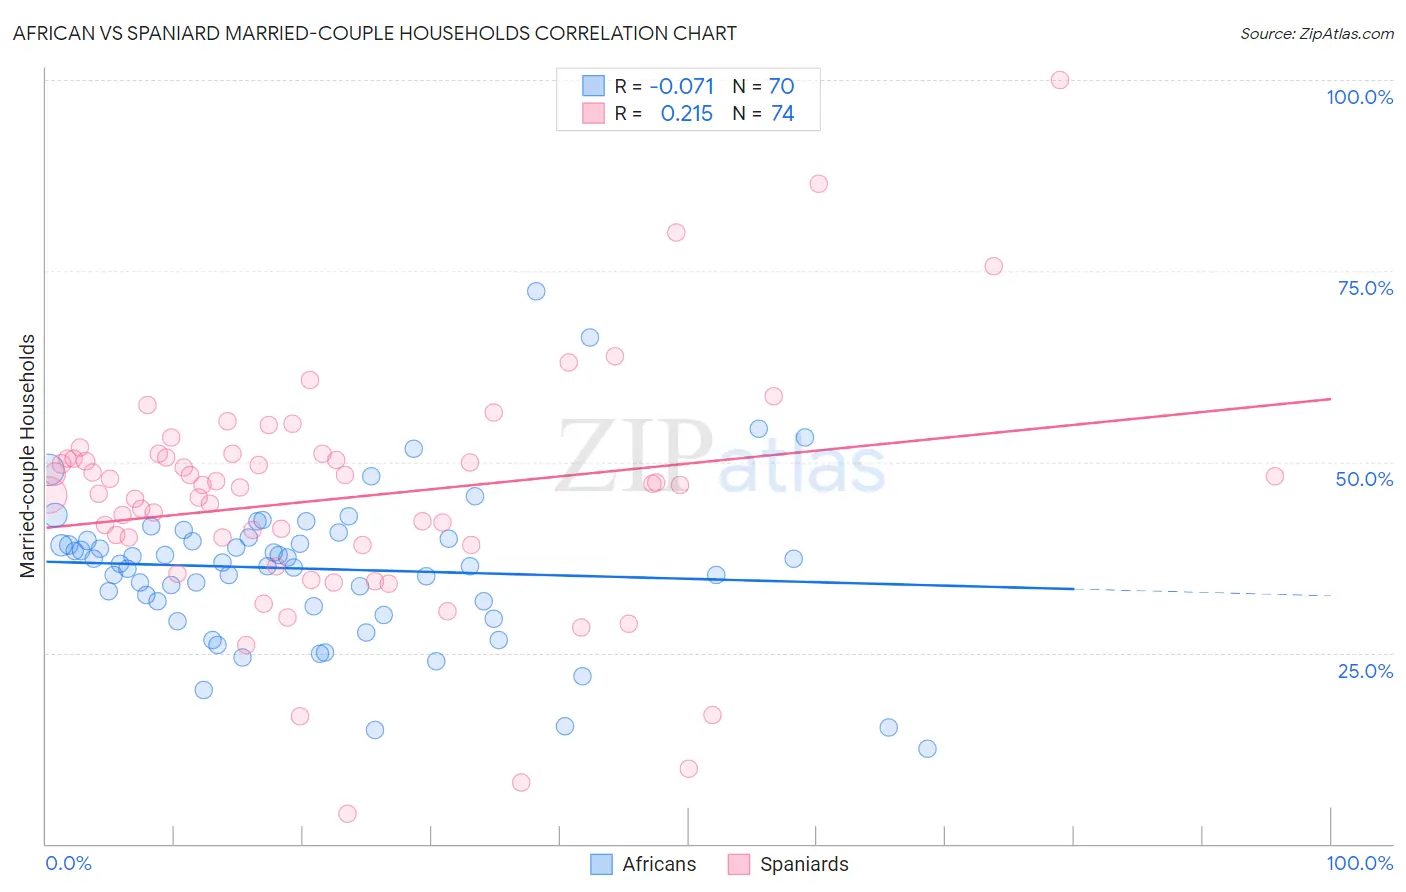
African vs Spaniard Married-couple Households Correlation Chart
The statistical analysis conducted on geographies consisting of 469,585,166 people shows a slight negative correlation between the proportion of Africans and percentage of married-couple family households in the United States with a correlation coefficient (R) of -0.071 and weighted average of 40.9%. Similarly, the statistical analysis conducted on geographies consisting of 443,146,700 people shows a weak positive correlation between the proportion of Spaniards and percentage of married-couple family households in the United States with a correlation coefficient (R) of 0.215 and weighted average of 47.2%, a difference of 15.2%.
Married-couple Households Correlation Summary
| Measurement | African | Spaniard |
| Minimum | 12.5% | 4.0% |
| Maximum | 72.3% | 100.0% |
| Range | 59.8% | 96.0% |
| Mean | 36.0% | 45.3% |
| Median | 36.7% | 47.0% |
| Interquartile 25% (IQ1) | 31.1% | 39.1% |
| Interquartile 75% (IQ3) | 39.9% | 50.6% |
| Interquartile Range (IQR) | 8.8% | 11.4% |
| Standard Deviation (Sample) | 10.3% | 15.4% |
| Standard Deviation (Population) | 10.2% | 15.3% |
Similar Demographics by Married-couple Households
Demographics Similar to Africans by Married-couple Households
In terms of married-couple households, the demographic groups most similar to Africans are Immigrants from Haiti (40.9%, a difference of 0.060%), Colville (41.0%, a difference of 0.090%), Jamaican (40.9%, a difference of 0.14%), Trinidadian and Tobagonian (40.9%, a difference of 0.22%), and Immigrants from Caribbean (40.8%, a difference of 0.40%).
| Demographics | Rating | Rank | Married-couple Households |
| Sioux | 0.0 /100 | #305 | Tragic 41.5% |
| Guyanese | 0.0 /100 | #306 | Tragic 41.4% |
| Immigrants | Western Africa | 0.0 /100 | #307 | Tragic 41.4% |
| Crow | 0.0 /100 | #308 | Tragic 41.4% |
| Immigrants | Trinidad and Tobago | 0.0 /100 | #309 | Tragic 41.2% |
| Haitians | 0.0 /100 | #310 | Tragic 41.2% |
| Colville | 0.0 /100 | #311 | Tragic 41.0% |
| Africans | 0.0 /100 | #312 | Tragic 40.9% |
| Immigrants | Haiti | 0.0 /100 | #313 | Tragic 40.9% |
| Jamaicans | 0.0 /100 | #314 | Tragic 40.9% |
| Trinidadians and Tobagonians | 0.0 /100 | #315 | Tragic 40.9% |
| Immigrants | Caribbean | 0.0 /100 | #316 | Tragic 40.8% |
| Immigrants | Jamaica | 0.0 /100 | #317 | Tragic 40.7% |
| Liberians | 0.0 /100 | #318 | Tragic 40.7% |
| Bahamians | 0.0 /100 | #319 | Tragic 40.5% |
Demographics Similar to Spaniards by Married-couple Households
In terms of married-couple households, the demographic groups most similar to Spaniards are Spanish (47.2%, a difference of 0.020%), Costa Rican (47.2%, a difference of 0.020%), Immigrants from Belarus (47.2%, a difference of 0.020%), Immigrants from Sweden (47.2%, a difference of 0.040%), and Mexican (47.1%, a difference of 0.050%).
| Demographics | Rating | Rank | Married-couple Households |
| Immigrants | Argentina | 86.0 /100 | #135 | Excellent 47.2% |
| New Zealanders | 85.3 /100 | #136 | Excellent 47.2% |
| Immigrants | Malaysia | 85.2 /100 | #137 | Excellent 47.2% |
| Immigrants | Afghanistan | 85.1 /100 | #138 | Excellent 47.2% |
| Immigrants | Sweden | 84.7 /100 | #139 | Excellent 47.2% |
| Spanish | 84.5 /100 | #140 | Excellent 47.2% |
| Costa Ricans | 84.4 /100 | #141 | Excellent 47.2% |
| Spaniards | 84.1 /100 | #142 | Excellent 47.2% |
| Immigrants | Belarus | 83.8 /100 | #143 | Excellent 47.2% |
| Mexicans | 83.4 /100 | #144 | Excellent 47.1% |
| Slovenes | 81.7 /100 | #145 | Excellent 47.1% |
| Immigrants | Western Europe | 81.6 /100 | #146 | Excellent 47.1% |
| Immigrants | Syria | 81.6 /100 | #147 | Excellent 47.1% |
| Icelanders | 79.5 /100 | #148 | Good 47.0% |
| Paraguayans | 78.7 /100 | #149 | Good 47.0% |