African vs Spaniard Single Mother Poverty
COMPARE
African
Spaniard
Single Mother Poverty
Single Mother Poverty Comparison
Africans
Spaniards
33.3%
SINGLE MOTHER POVERTY
0.0/ 100
METRIC RATING
298th/ 347
METRIC RANK
30.2%
SINGLE MOTHER POVERTY
5.4/ 100
METRIC RATING
228th/ 347
METRIC RANK
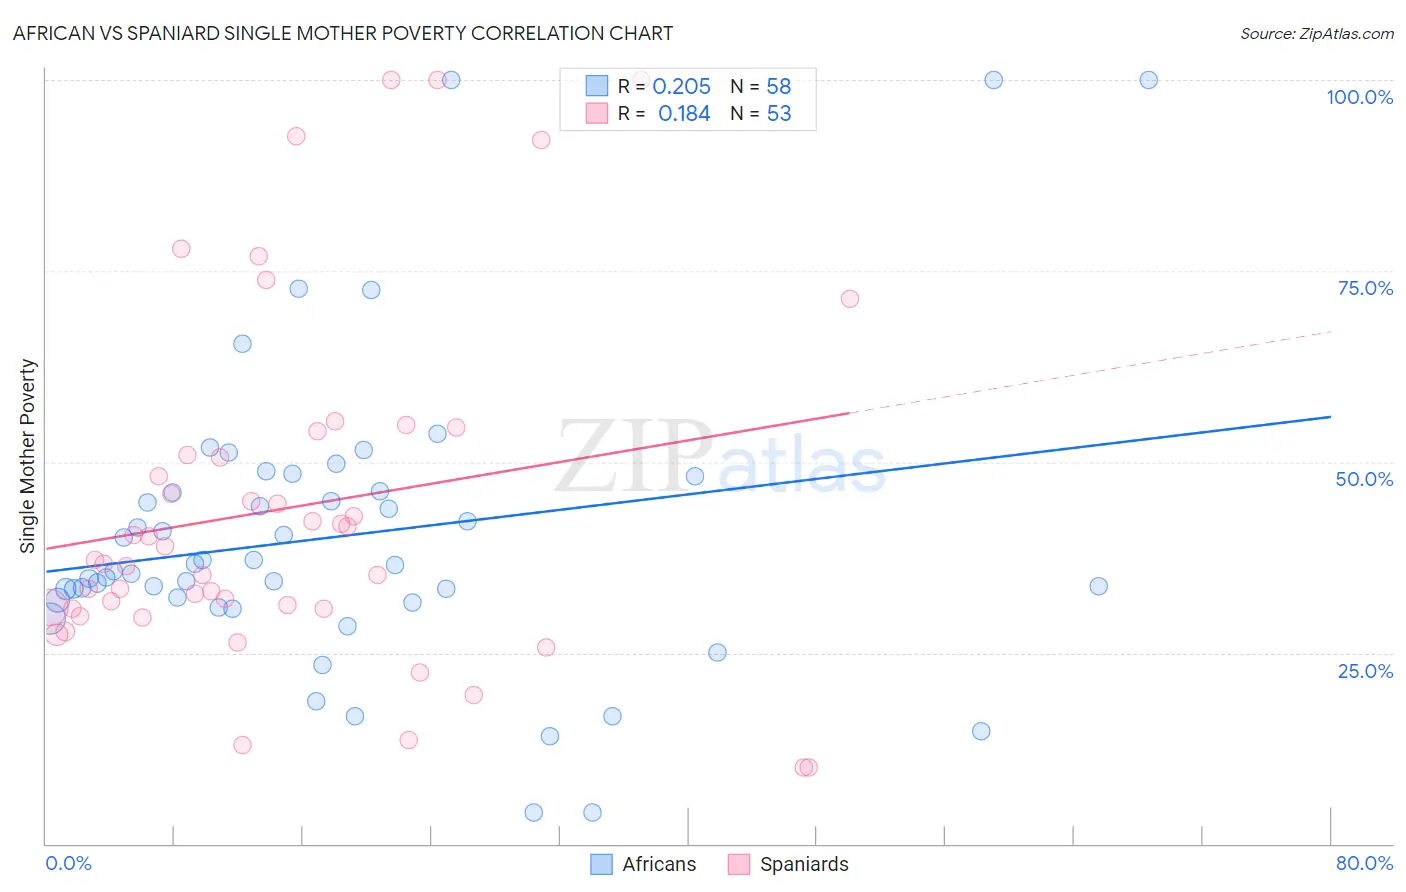
African vs Spaniard Single Mother Poverty Correlation Chart
The statistical analysis conducted on geographies consisting of 460,032,526 people shows a weak positive correlation between the proportion of Africans and poverty level among single mothers in the United States with a correlation coefficient (R) of 0.205 and weighted average of 33.3%. Similarly, the statistical analysis conducted on geographies consisting of 431,071,159 people shows a poor positive correlation between the proportion of Spaniards and poverty level among single mothers in the United States with a correlation coefficient (R) of 0.184 and weighted average of 30.2%, a difference of 10.3%.
Single Mother Poverty Correlation Summary
| Measurement | African | Spaniard |
| Minimum | 4.1% | 10.0% |
| Maximum | 100.0% | 100.0% |
| Range | 95.9% | 90.0% |
| Mean | 40.2% | 44.0% |
| Median | 36.1% | 37.1% |
| Interquartile 25% (IQ1) | 31.9% | 30.8% |
| Interquartile 75% (IQ3) | 46.1% | 52.5% |
| Interquartile Range (IQR) | 14.2% | 21.7% |
| Standard Deviation (Sample) | 19.5% | 22.9% |
| Standard Deviation (Population) | 19.3% | 22.7% |
Similar Demographics by Single Mother Poverty
Demographics Similar to Africans by Single Mother Poverty
In terms of single mother poverty, the demographic groups most similar to Africans are Immigrants from Guatemala (33.3%, a difference of 0.090%), Hispanic or Latino (33.3%, a difference of 0.090%), Pennsylvania German (33.2%, a difference of 0.11%), Blackfeet (33.2%, a difference of 0.25%), and Immigrants from Somalia (33.4%, a difference of 0.33%).
| Demographics | Rating | Rank | Single Mother Poverty |
| Guatemalans | 0.0 /100 | #291 | Tragic 32.9% |
| Shoshone | 0.0 /100 | #292 | Tragic 32.9% |
| Aleuts | 0.0 /100 | #293 | Tragic 32.9% |
| French American Indians | 0.0 /100 | #294 | Tragic 33.1% |
| Yaqui | 0.0 /100 | #295 | Tragic 33.1% |
| Blackfeet | 0.0 /100 | #296 | Tragic 33.2% |
| Pennsylvania Germans | 0.0 /100 | #297 | Tragic 33.2% |
| Africans | 0.0 /100 | #298 | Tragic 33.3% |
| Immigrants | Guatemala | 0.0 /100 | #299 | Tragic 33.3% |
| Hispanics or Latinos | 0.0 /100 | #300 | Tragic 33.3% |
| Immigrants | Somalia | 0.0 /100 | #301 | Tragic 33.4% |
| Arapaho | 0.0 /100 | #302 | Tragic 33.4% |
| Americans | 0.0 /100 | #303 | Tragic 33.5% |
| Mexicans | 0.0 /100 | #304 | Tragic 33.6% |
| Immigrants | Central America | 0.0 /100 | #305 | Tragic 33.6% |
Demographics Similar to Spaniards by Single Mother Poverty
In terms of single mother poverty, the demographic groups most similar to Spaniards are Immigrants from Barbados (30.2%, a difference of 0.090%), Immigrants from Liberia (30.1%, a difference of 0.11%), English (30.2%, a difference of 0.13%), Scottish (30.1%, a difference of 0.14%), and Spanish (30.1%, a difference of 0.20%).
| Demographics | Rating | Rank | Single Mother Poverty |
| Immigrants | Eritrea | 7.7 /100 | #221 | Tragic 30.0% |
| Sudanese | 7.6 /100 | #222 | Tragic 30.0% |
| Immigrants | Cuba | 6.9 /100 | #223 | Tragic 30.1% |
| Immigrants | Sudan | 6.5 /100 | #224 | Tragic 30.1% |
| Spanish | 6.3 /100 | #225 | Tragic 30.1% |
| Scottish | 6.0 /100 | #226 | Tragic 30.1% |
| Immigrants | Liberia | 5.9 /100 | #227 | Tragic 30.1% |
| Spaniards | 5.4 /100 | #228 | Tragic 30.2% |
| Immigrants | Barbados | 5.0 /100 | #229 | Tragic 30.2% |
| English | 4.8 /100 | #230 | Tragic 30.2% |
| Dutch | 4.3 /100 | #231 | Tragic 30.2% |
| Alaskan Athabascans | 4.1 /100 | #232 | Tragic 30.3% |
| Immigrants | Middle Africa | 3.5 /100 | #233 | Tragic 30.3% |
| Immigrants | Nicaragua | 3.5 /100 | #234 | Tragic 30.3% |
| Immigrants | Grenada | 3.4 /100 | #235 | Tragic 30.3% |