Dutch vs New Zealander Average Family Size
COMPARE
Dutch
New Zealander
Average Family Size
Average Family Size Comparison
Dutch
New Zealanders
3.11
AVERAGE FAMILY SIZE
0.0/ 100
METRIC RATING
327th/ 347
METRIC RANK
3.15
AVERAGE FAMILY SIZE
0.6/ 100
METRIC RATING
273rd/ 347
METRIC RANK
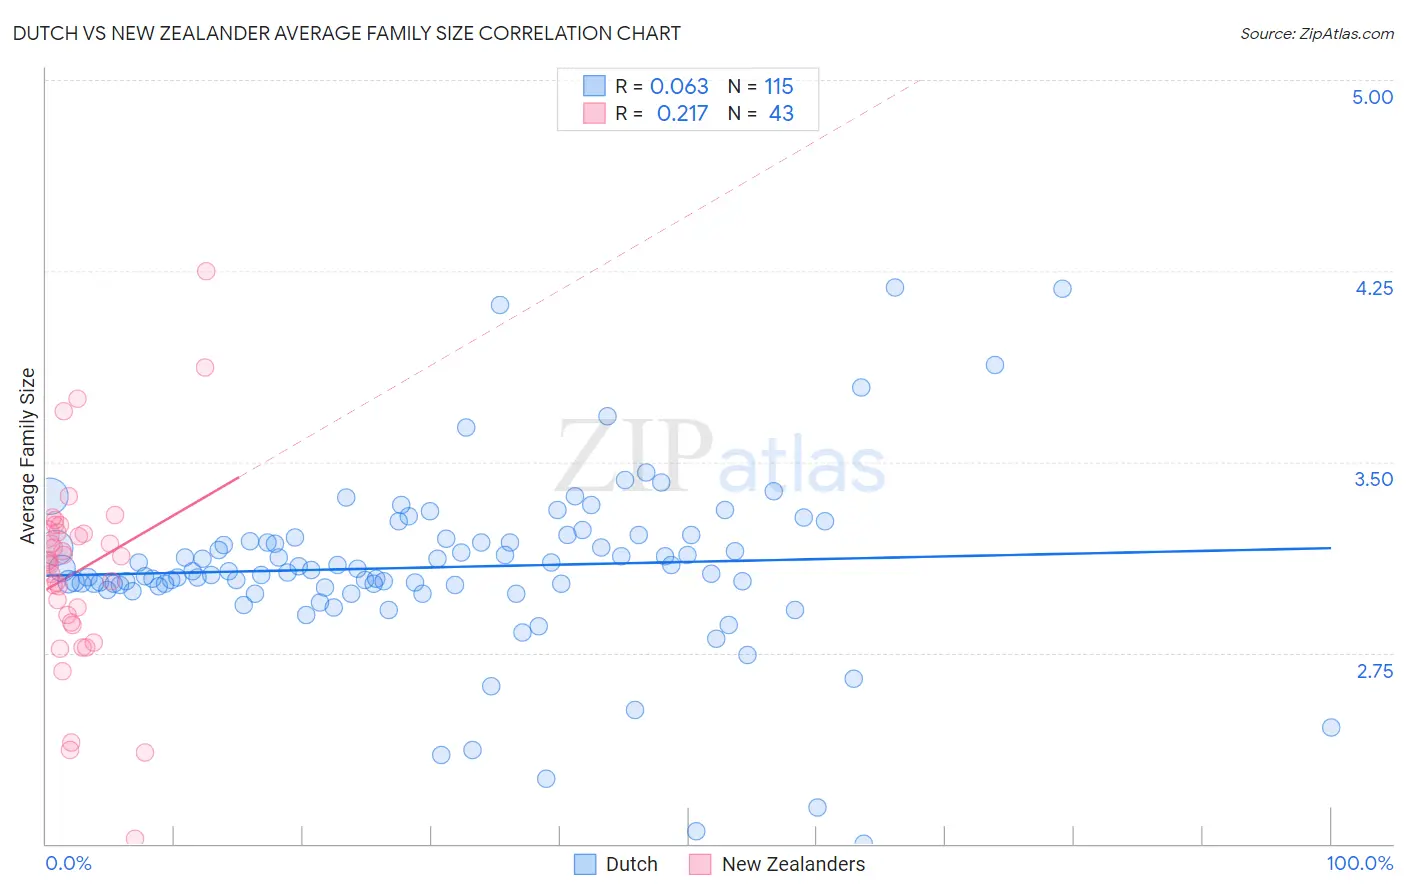
Dutch vs New Zealander Average Family Size Correlation Chart
The statistical analysis conducted on geographies consisting of 553,876,215 people shows a slight positive correlation between the proportion of Dutch and average family size in the United States with a correlation coefficient (R) of 0.063 and weighted average of 3.11. Similarly, the statistical analysis conducted on geographies consisting of 106,893,950 people shows a weak positive correlation between the proportion of New Zealanders and average family size in the United States with a correlation coefficient (R) of 0.217 and weighted average of 3.15, a difference of 1.4%.
Average Family Size Correlation Summary
| Measurement | Dutch | New Zealander |
| Minimum | 2.00 | 2.02 |
| Maximum | 4.19 | 4.25 |
| Range | 2.19 | 2.23 |
| Mean | 3.09 | 3.07 |
| Median | 3.07 | 3.11 |
| Interquartile 25% (IQ1) | 3.01 | 2.87 |
| Interquartile 75% (IQ3) | 3.20 | 3.22 |
| Interquartile Range (IQR) | 0.19 | 0.35 |
| Standard Deviation (Sample) | 0.34 | 0.39 |
| Standard Deviation (Population) | 0.34 | 0.39 |
Similar Demographics by Average Family Size
Demographics Similar to Dutch by Average Family Size
In terms of average family size, the demographic groups most similar to Dutch are Czech (3.11, a difference of 0.0%), Ottawa (3.11, a difference of 0.010%), English (3.11, a difference of 0.060%), Belgian (3.11, a difference of 0.060%), and Celtic (3.11, a difference of 0.10%).
| Demographics | Rating | Rank | Average Family Size |
| Immigrants | North America | 0.0 /100 | #320 | Tragic 3.12 |
| Immigrants | Austria | 0.0 /100 | #321 | Tragic 3.12 |
| Immigrants | Canada | 0.0 /100 | #322 | Tragic 3.12 |
| Soviet Union | 0.0 /100 | #323 | Tragic 3.11 |
| Celtics | 0.0 /100 | #324 | Tragic 3.11 |
| English | 0.0 /100 | #325 | Tragic 3.11 |
| Ottawa | 0.0 /100 | #326 | Tragic 3.11 |
| Dutch | 0.0 /100 | #327 | Tragic 3.11 |
| Czechs | 0.0 /100 | #328 | Tragic 3.11 |
| Belgians | 0.0 /100 | #329 | Tragic 3.11 |
| Latvians | 0.0 /100 | #330 | Tragic 3.11 |
| Scotch-Irish | 0.0 /100 | #331 | Tragic 3.11 |
| Scottish | 0.0 /100 | #332 | Tragic 3.11 |
| Estonians | 0.0 /100 | #333 | Tragic 3.10 |
| Lithuanians | 0.0 /100 | #334 | Tragic 3.10 |
Demographics Similar to New Zealanders by Average Family Size
In terms of average family size, the demographic groups most similar to New Zealanders are Immigrants from Belgium (3.15, a difference of 0.0%), Immigrants from Lithuania (3.15, a difference of 0.010%), Cambodian (3.15, a difference of 0.010%), Immigrants from Germany (3.15, a difference of 0.030%), and Tlingit-Haida (3.16, a difference of 0.060%).
| Demographics | Rating | Rank | Average Family Size |
| Immigrants | Greece | 0.9 /100 | #266 | Tragic 3.16 |
| Iroquois | 0.8 /100 | #267 | Tragic 3.16 |
| Maltese | 0.8 /100 | #268 | Tragic 3.16 |
| Immigrants | Singapore | 0.7 /100 | #269 | Tragic 3.16 |
| Tlingit-Haida | 0.7 /100 | #270 | Tragic 3.16 |
| Immigrants | Germany | 0.7 /100 | #271 | Tragic 3.15 |
| Immigrants | Lithuania | 0.6 /100 | #272 | Tragic 3.15 |
| New Zealanders | 0.6 /100 | #273 | Tragic 3.15 |
| Immigrants | Belgium | 0.6 /100 | #274 | Tragic 3.15 |
| Cambodians | 0.6 /100 | #275 | Tragic 3.15 |
| Immigrants | Bosnia and Herzegovina | 0.5 /100 | #276 | Tragic 3.15 |
| Swiss | 0.5 /100 | #277 | Tragic 3.15 |
| Okinawans | 0.5 /100 | #278 | Tragic 3.15 |
| Immigrants | Europe | 0.5 /100 | #279 | Tragic 3.15 |
| Immigrants | England | 0.4 /100 | #280 | Tragic 3.15 |