African vs Immigrants from Cameroon Child Poverty Under the Age of 16
COMPARE
African
Immigrants from Cameroon
Child Poverty Under the Age of 16
Child Poverty Under the Age of 16 Comparison
Africans
Immigrants from Cameroon
21.7%
CHILD POVERTY UNDER THE AGE OF 16
0.0/ 100
METRIC RATING
316th/ 347
METRIC RANK
17.1%
CHILD POVERTY UNDER THE AGE OF 16
14.7/ 100
METRIC RATING
200th/ 347
METRIC RANK
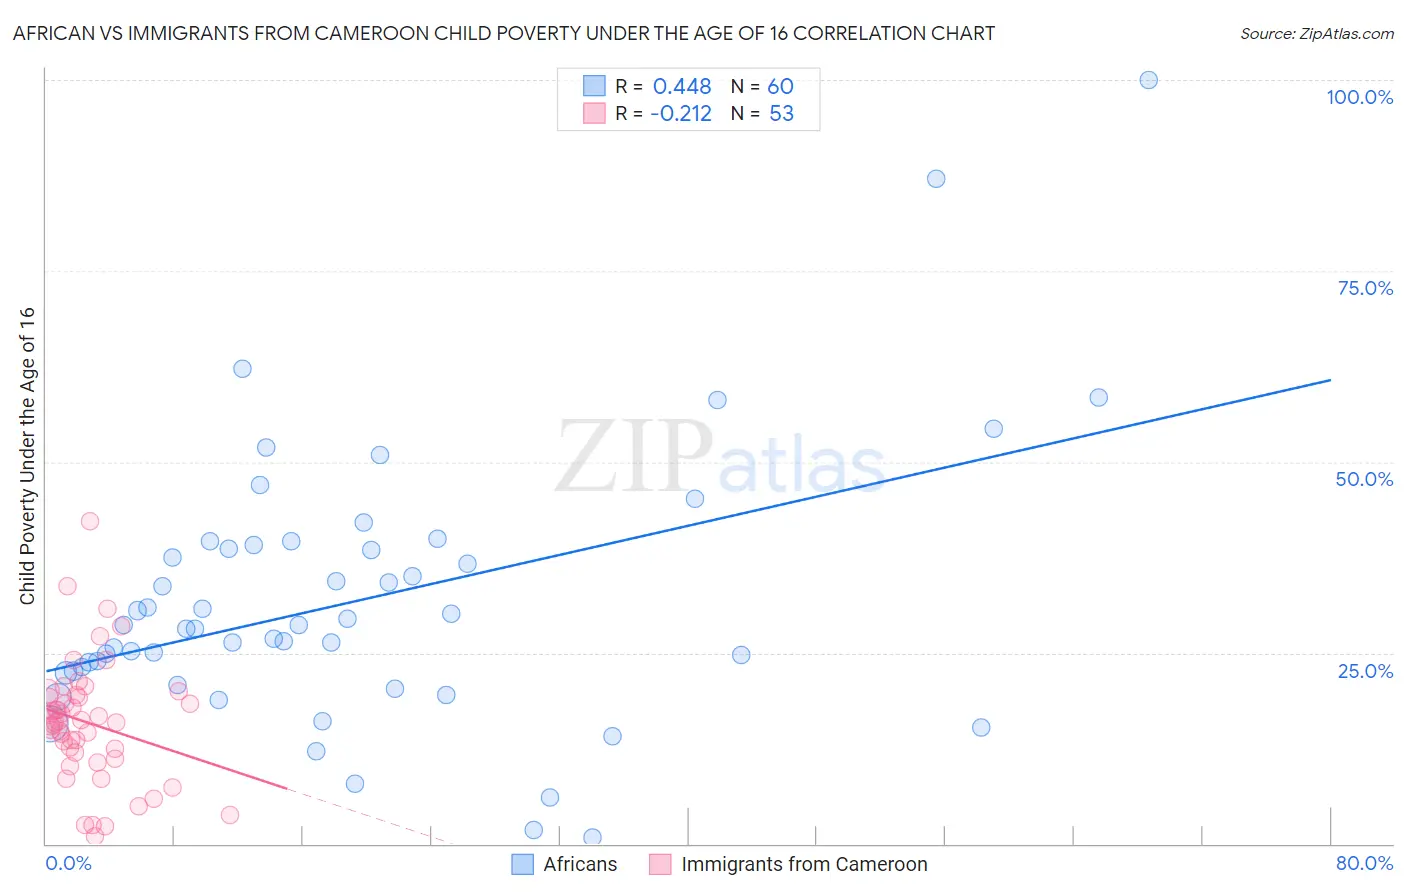
African vs Immigrants from Cameroon Child Poverty Under the Age of 16 Correlation Chart
The statistical analysis conducted on geographies consisting of 466,270,452 people shows a moderate positive correlation between the proportion of Africans and poverty level among children under the age of 16 in the United States with a correlation coefficient (R) of 0.448 and weighted average of 21.7%. Similarly, the statistical analysis conducted on geographies consisting of 130,547,107 people shows a weak negative correlation between the proportion of Immigrants from Cameroon and poverty level among children under the age of 16 in the United States with a correlation coefficient (R) of -0.212 and weighted average of 17.1%, a difference of 27.2%.
Child Poverty Under the Age of 16 Correlation Summary
| Measurement | African | Immigrants from Cameroon |
| Minimum | 0.88% | 0.90% |
| Maximum | 100.0% | 42.2% |
| Range | 99.1% | 41.3% |
| Mean | 31.8% | 15.8% |
| Median | 28.4% | 15.9% |
| Interquartile 25% (IQ1) | 22.5% | 11.5% |
| Interquartile 75% (IQ3) | 38.9% | 19.4% |
| Interquartile Range (IQR) | 16.5% | 7.8% |
| Standard Deviation (Sample) | 17.6% | 8.0% |
| Standard Deviation (Population) | 17.5% | 7.9% |
Similar Demographics by Child Poverty Under the Age of 16
Demographics Similar to Africans by Child Poverty Under the Age of 16
In terms of child poverty under the age of 16, the demographic groups most similar to Africans are Immigrants from Guatemala (21.6%, a difference of 0.42%), Immigrants from Somalia (21.6%, a difference of 0.56%), Creek (21.5%, a difference of 0.76%), Immigrants from Dominica (21.9%, a difference of 0.77%), and Ute (21.5%, a difference of 0.79%).
| Demographics | Rating | Rank | Child Poverty Under the Age of 16 |
| Immigrants | Mexico | 0.0 /100 | #309 | Tragic 21.5% |
| Bahamians | 0.0 /100 | #310 | Tragic 21.5% |
| Dutch West Indians | 0.0 /100 | #311 | Tragic 21.5% |
| Ute | 0.0 /100 | #312 | Tragic 21.5% |
| Creek | 0.0 /100 | #313 | Tragic 21.5% |
| Immigrants | Somalia | 0.0 /100 | #314 | Tragic 21.6% |
| Immigrants | Guatemala | 0.0 /100 | #315 | Tragic 21.6% |
| Africans | 0.0 /100 | #316 | Tragic 21.7% |
| Immigrants | Dominica | 0.0 /100 | #317 | Tragic 21.9% |
| U.S. Virgin Islanders | 0.0 /100 | #318 | Tragic 22.0% |
| Yakama | 0.0 /100 | #319 | Tragic 22.1% |
| Cajuns | 0.0 /100 | #320 | Tragic 22.1% |
| Kiowa | 0.0 /100 | #321 | Tragic 22.2% |
| Hondurans | 0.0 /100 | #322 | Tragic 22.2% |
| Paiute | 0.0 /100 | #323 | Tragic 22.4% |
Demographics Similar to Immigrants from Cameroon by Child Poverty Under the Age of 16
In terms of child poverty under the age of 16, the demographic groups most similar to Immigrants from Cameroon are Immigrants from Uzbekistan (17.1%, a difference of 0.010%), Ugandan (17.1%, a difference of 0.090%), Immigrants from Afghanistan (17.0%, a difference of 0.10%), Immigrants from Sierra Leone (17.1%, a difference of 0.11%), and Hmong (17.1%, a difference of 0.17%).
| Demographics | Rating | Rank | Child Poverty Under the Age of 16 |
| Spaniards | 23.2 /100 | #193 | Fair 16.8% |
| Immigrants | Uruguay | 23.1 /100 | #194 | Fair 16.8% |
| Immigrants | Uganda | 22.5 /100 | #195 | Fair 16.8% |
| Immigrants | Lebanon | 22.0 /100 | #196 | Fair 16.8% |
| Immigrants | Kenya | 19.1 /100 | #197 | Poor 16.9% |
| Delaware | 17.1 /100 | #198 | Poor 17.0% |
| Immigrants | Afghanistan | 15.1 /100 | #199 | Poor 17.0% |
| Immigrants | Cameroon | 14.7 /100 | #200 | Poor 17.1% |
| Immigrants | Uzbekistan | 14.7 /100 | #201 | Poor 17.1% |
| Ugandans | 14.3 /100 | #202 | Poor 17.1% |
| Immigrants | Sierra Leone | 14.2 /100 | #203 | Poor 17.1% |
| Hmong | 14.0 /100 | #204 | Poor 17.1% |
| Aleuts | 13.9 /100 | #205 | Poor 17.1% |
| Alaska Natives | 11.8 /100 | #206 | Poor 17.2% |
| German Russians | 8.6 /100 | #207 | Tragic 17.4% |