Chilean vs Carpatho Rusyn Divorced or Separated
COMPARE
Chilean
Carpatho Rusyn
Divorced or Separated
Divorced or Separated Comparison
Chileans
Carpatho Rusyns
12.0%
DIVORCED OR SEPARATED
71.3/ 100
METRIC RATING
154th/ 347
METRIC RANK
11.9%
DIVORCED OR SEPARATED
84.8/ 100
METRIC RATING
136th/ 347
METRIC RANK
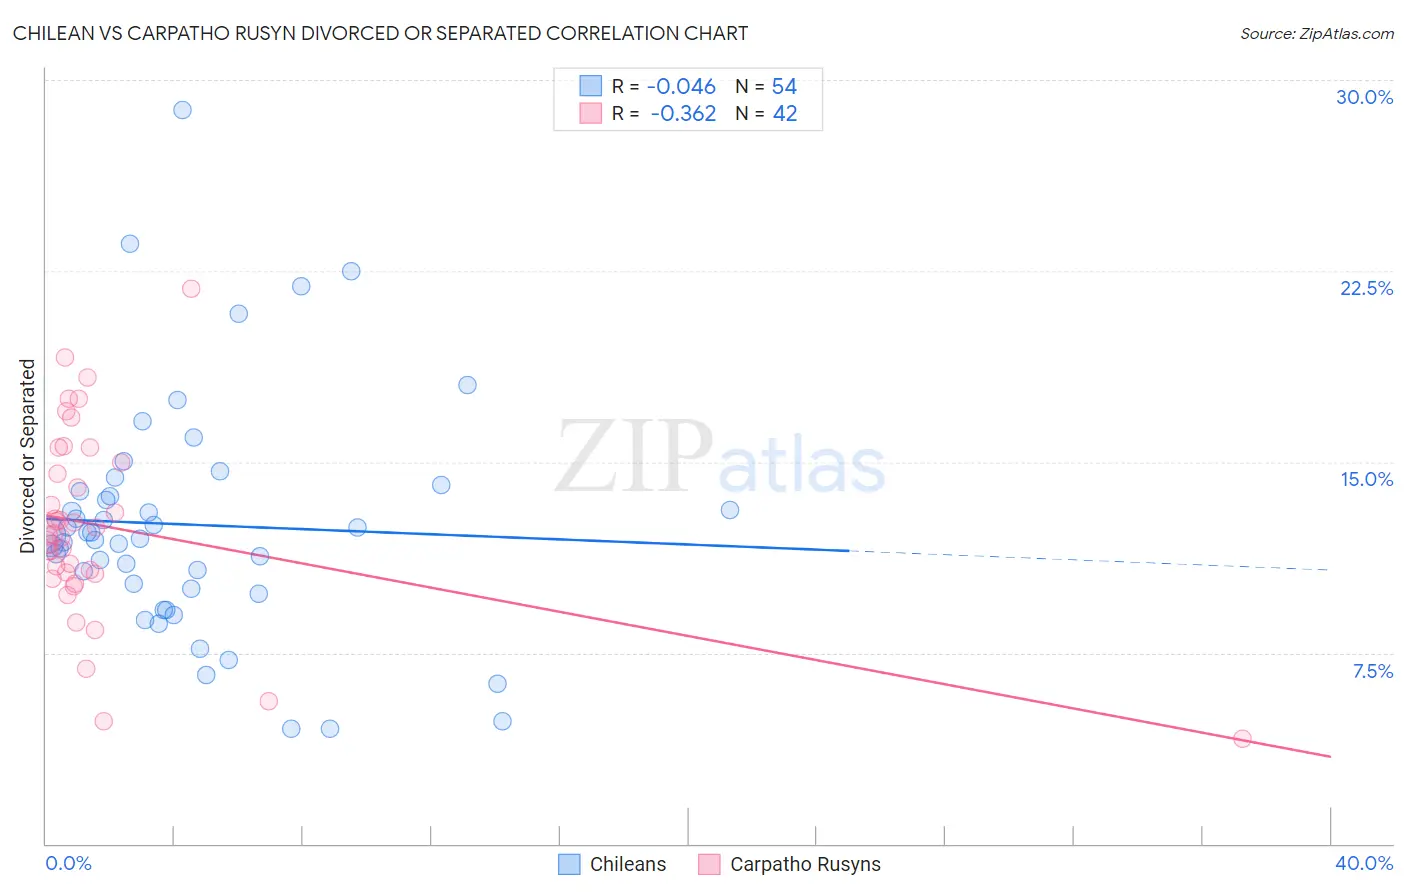
Chilean vs Carpatho Rusyn Divorced or Separated Correlation Chart
The statistical analysis conducted on geographies consisting of 256,589,464 people shows no correlation between the proportion of Chileans and percentage of population currently divorced or separated in the United States with a correlation coefficient (R) of -0.046 and weighted average of 12.0%. Similarly, the statistical analysis conducted on geographies consisting of 58,871,690 people shows a mild negative correlation between the proportion of Carpatho Rusyns and percentage of population currently divorced or separated in the United States with a correlation coefficient (R) of -0.362 and weighted average of 11.9%, a difference of 0.71%.
Divorced or Separated Correlation Summary
| Measurement | Chilean | Carpatho Rusyn |
| Minimum | 4.5% | 4.1% |
| Maximum | 28.8% | 21.8% |
| Range | 24.3% | 17.7% |
| Mean | 12.5% | 12.5% |
| Median | 12.0% | 12.1% |
| Interquartile 25% (IQ1) | 10.0% | 10.6% |
| Interquartile 75% (IQ3) | 13.9% | 15.0% |
| Interquartile Range (IQR) | 3.9% | 4.4% |
| Standard Deviation (Sample) | 4.7% | 3.7% |
| Standard Deviation (Population) | 4.6% | 3.7% |
Demographics Similar to Chileans and Carpatho Rusyns by Divorced or Separated
In terms of divorced or separated, the demographic groups most similar to Chileans are Japanese (12.0%, a difference of 0.020%), Austrian (12.0%, a difference of 0.040%), Immigrants from Hungary (11.9%, a difference of 0.10%), Czech (11.9%, a difference of 0.23%), and Immigrants from Portugal (11.9%, a difference of 0.27%). Similarly, the demographic groups most similar to Carpatho Rusyns are Danish (11.9%, a difference of 0.0%), Alsatian (11.9%, a difference of 0.060%), Immigrants from Netherlands (11.9%, a difference of 0.060%), Australian (11.9%, a difference of 0.080%), and Lebanese (11.9%, a difference of 0.090%).
| Demographics | Rating | Rank | Divorced or Separated |
| Danes | 84.8 /100 | #135 | Excellent 11.9% |
| Carpatho Rusyns | 84.8 /100 | #136 | Excellent 11.9% |
| Alsatians | 84.0 /100 | #137 | Excellent 11.9% |
| Immigrants | Netherlands | 83.9 /100 | #138 | Excellent 11.9% |
| Australians | 83.6 /100 | #139 | Excellent 11.9% |
| Lebanese | 83.4 /100 | #140 | Excellent 11.9% |
| Immigrants | Morocco | 82.9 /100 | #141 | Excellent 11.9% |
| Immigrants | Zimbabwe | 81.5 /100 | #142 | Excellent 11.9% |
| Pakistanis | 81.3 /100 | #143 | Excellent 11.9% |
| Peruvians | 80.9 /100 | #144 | Excellent 11.9% |
| Croatians | 80.6 /100 | #145 | Excellent 11.9% |
| Immigrants | Grenada | 79.1 /100 | #146 | Good 11.9% |
| Poles | 78.6 /100 | #147 | Good 11.9% |
| Italians | 77.8 /100 | #148 | Good 11.9% |
| Immigrants | Oceania | 77.7 /100 | #149 | Good 11.9% |
| Immigrants | Portugal | 77.3 /100 | #150 | Good 11.9% |
| Czechs | 76.4 /100 | #151 | Good 11.9% |
| Immigrants | Hungary | 73.7 /100 | #152 | Good 11.9% |
| Austrians | 72.2 /100 | #153 | Good 12.0% |
| Chileans | 71.3 /100 | #154 | Good 12.0% |
| Japanese | 70.9 /100 | #155 | Good 12.0% |