Afghan vs Immigrants from Venezuela Single Father Households
COMPARE
Afghan
Immigrants from Venezuela
Single Father Households
Single Father Households Comparison
Afghans
Immigrants from Venezuela
2.3%
SINGLE FATHER HOUSEHOLDS
50.0/ 100
METRIC RATING
174th/ 347
METRIC RANK
2.3%
SINGLE FATHER HOUSEHOLDS
83.2/ 100
METRIC RATING
152nd/ 347
METRIC RANK
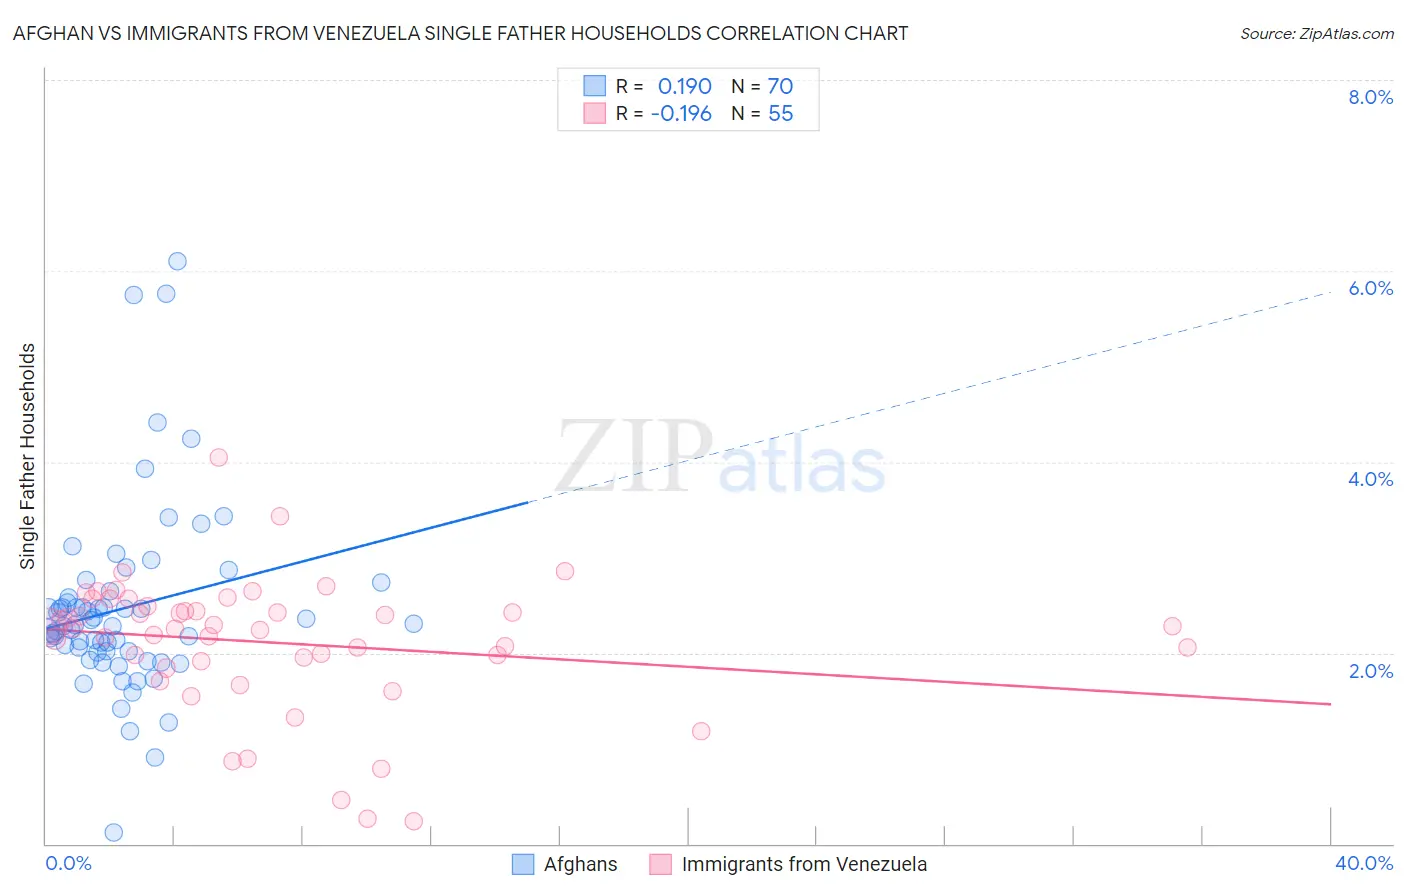
Afghan vs Immigrants from Venezuela Single Father Households Correlation Chart
The statistical analysis conducted on geographies consisting of 148,375,080 people shows a poor positive correlation between the proportion of Afghans and percentage of single father households in the United States with a correlation coefficient (R) of 0.190 and weighted average of 2.3%. Similarly, the statistical analysis conducted on geographies consisting of 286,595,714 people shows a poor negative correlation between the proportion of Immigrants from Venezuela and percentage of single father households in the United States with a correlation coefficient (R) of -0.196 and weighted average of 2.3%, a difference of 3.0%.
Single Father Households Correlation Summary
| Measurement | Afghan | Immigrants from Venezuela |
| Minimum | 0.11% | 0.23% |
| Maximum | 6.1% | 4.1% |
| Range | 6.0% | 3.8% |
| Mean | 2.5% | 2.1% |
| Median | 2.3% | 2.3% |
| Interquartile 25% (IQ1) | 2.0% | 1.9% |
| Interquartile 75% (IQ3) | 2.6% | 2.5% |
| Interquartile Range (IQR) | 0.57% | 0.58% |
| Standard Deviation (Sample) | 0.99% | 0.71% |
| Standard Deviation (Population) | 0.98% | 0.70% |
Similar Demographics by Single Father Households
Demographics Similar to Afghans by Single Father Households
In terms of single father households, the demographic groups most similar to Afghans are Immigrants from Jamaica (2.3%, a difference of 0.070%), Danish (2.3%, a difference of 0.13%), Colombian (2.3%, a difference of 0.14%), Celtic (2.3%, a difference of 0.40%), and Costa Rican (2.3%, a difference of 0.44%).
| Demographics | Rating | Rank | Single Father Households |
| South Americans | 64.3 /100 | #167 | Good 2.3% |
| Icelanders | 63.1 /100 | #168 | Good 2.3% |
| Czechs | 62.5 /100 | #169 | Good 2.3% |
| Ugandans | 62.2 /100 | #170 | Good 2.3% |
| Swedes | 61.6 /100 | #171 | Good 2.3% |
| Czechoslovakians | 58.9 /100 | #172 | Average 2.3% |
| Celtics | 55.4 /100 | #173 | Average 2.3% |
| Afghans | 50.0 /100 | #174 | Average 2.3% |
| Immigrants | Jamaica | 49.1 /100 | #175 | Average 2.3% |
| Danes | 48.2 /100 | #176 | Average 2.3% |
| Colombians | 48.0 /100 | #177 | Average 2.3% |
| Costa Ricans | 44.1 /100 | #178 | Average 2.3% |
| Welsh | 44.0 /100 | #179 | Average 2.3% |
| Yugoslavians | 43.9 /100 | #180 | Average 2.3% |
| Jamaicans | 43.5 /100 | #181 | Average 2.3% |
Demographics Similar to Immigrants from Venezuela by Single Father Households
In terms of single father households, the demographic groups most similar to Immigrants from Venezuela are Immigrants from Germany (2.3%, a difference of 0.050%), Immigrants from Syria (2.3%, a difference of 0.23%), Bolivian (2.3%, a difference of 0.28%), European (2.3%, a difference of 0.29%), and Immigrants from South America (2.3%, a difference of 0.41%).
| Demographics | Rating | Rank | Single Father Households |
| Immigrants | Zimbabwe | 90.2 /100 | #145 | Exceptional 2.2% |
| Northern Europeans | 89.8 /100 | #146 | Excellent 2.2% |
| Slavs | 88.9 /100 | #147 | Excellent 2.2% |
| South American Indians | 88.5 /100 | #148 | Excellent 2.3% |
| Senegalese | 88.4 /100 | #149 | Excellent 2.3% |
| Venezuelans | 86.2 /100 | #150 | Excellent 2.3% |
| Immigrants | Syria | 84.8 /100 | #151 | Excellent 2.3% |
| Immigrants | Venezuela | 83.2 /100 | #152 | Excellent 2.3% |
| Immigrants | Germany | 82.8 /100 | #153 | Excellent 2.3% |
| Bolivians | 81.0 /100 | #154 | Excellent 2.3% |
| Europeans | 80.9 /100 | #155 | Excellent 2.3% |
| Immigrants | South America | 79.9 /100 | #156 | Good 2.3% |
| Canadians | 79.7 /100 | #157 | Good 2.3% |
| Immigrants | Senegal | 79.4 /100 | #158 | Good 2.3% |
| Immigrants | West Indies | 77.9 /100 | #159 | Good 2.3% |