Afghan vs Immigrants from Taiwan Single Father Households
COMPARE
Afghan
Immigrants from Taiwan
Single Father Households
Single Father Households Comparison
Afghans
Immigrants from Taiwan
2.3%
SINGLE FATHER HOUSEHOLDS
50.0/ 100
METRIC RATING
174th/ 347
METRIC RANK
1.8%
SINGLE FATHER HOUSEHOLDS
100.0/ 100
METRIC RATING
6th/ 347
METRIC RANK
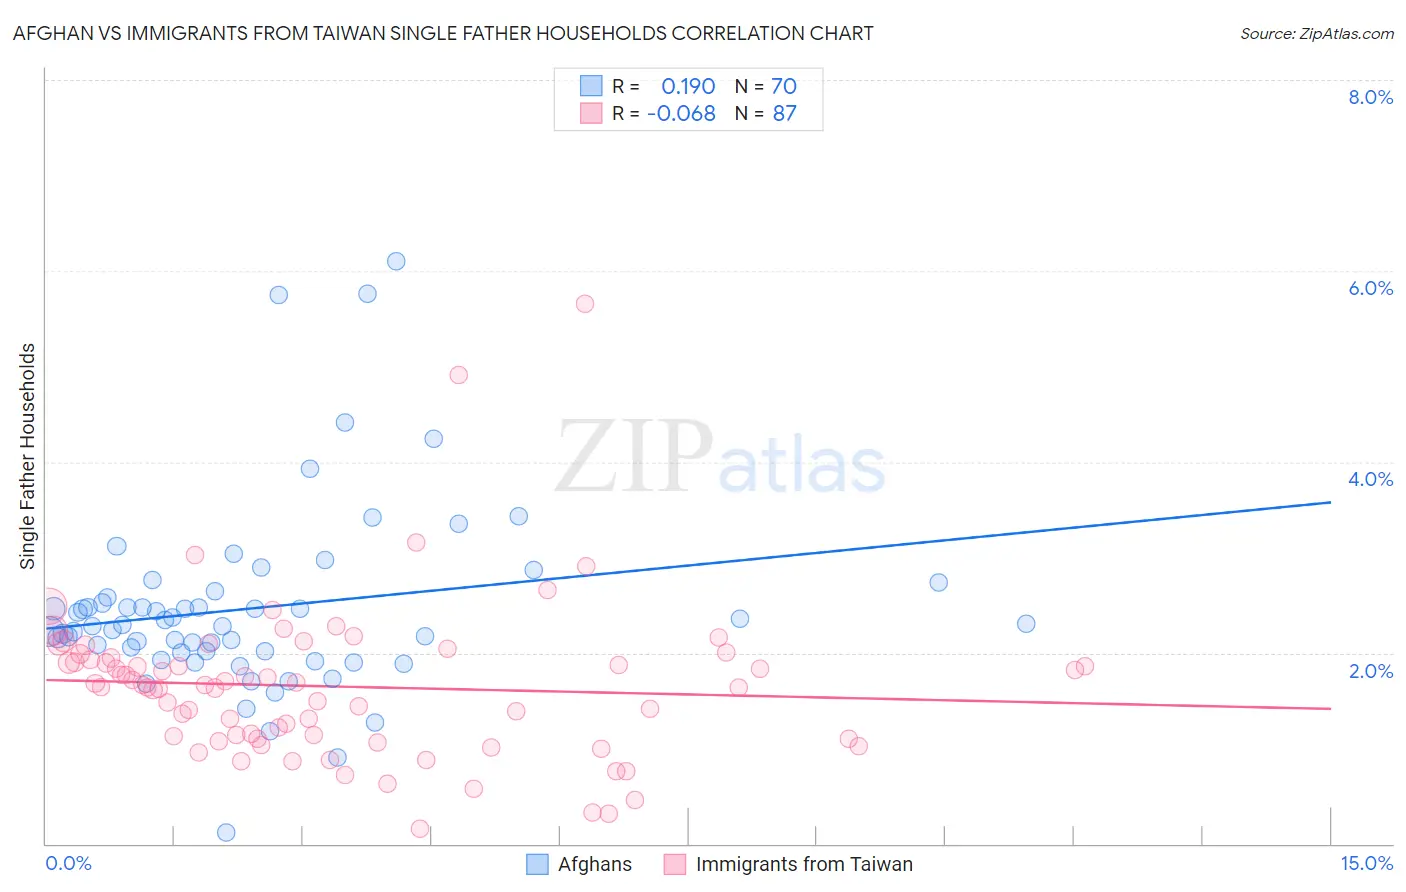
Afghan vs Immigrants from Taiwan Single Father Households Correlation Chart
The statistical analysis conducted on geographies consisting of 148,375,080 people shows a poor positive correlation between the proportion of Afghans and percentage of single father households in the United States with a correlation coefficient (R) of 0.190 and weighted average of 2.3%. Similarly, the statistical analysis conducted on geographies consisting of 296,358,565 people shows a slight negative correlation between the proportion of Immigrants from Taiwan and percentage of single father households in the United States with a correlation coefficient (R) of -0.068 and weighted average of 1.8%, a difference of 27.2%.
Single Father Households Correlation Summary
| Measurement | Afghan | Immigrants from Taiwan |
| Minimum | 0.11% | 0.15% |
| Maximum | 6.1% | 5.7% |
| Range | 6.0% | 5.5% |
| Mean | 2.5% | 1.6% |
| Median | 2.3% | 1.7% |
| Interquartile 25% (IQ1) | 2.0% | 1.1% |
| Interquartile 75% (IQ3) | 2.6% | 1.9% |
| Interquartile Range (IQR) | 0.57% | 0.84% |
| Standard Deviation (Sample) | 0.99% | 0.82% |
| Standard Deviation (Population) | 0.98% | 0.82% |
Similar Demographics by Single Father Households
Demographics Similar to Afghans by Single Father Households
In terms of single father households, the demographic groups most similar to Afghans are Immigrants from Jamaica (2.3%, a difference of 0.070%), Danish (2.3%, a difference of 0.13%), Colombian (2.3%, a difference of 0.14%), Celtic (2.3%, a difference of 0.40%), and Costa Rican (2.3%, a difference of 0.44%).
| Demographics | Rating | Rank | Single Father Households |
| South Americans | 64.3 /100 | #167 | Good 2.3% |
| Icelanders | 63.1 /100 | #168 | Good 2.3% |
| Czechs | 62.5 /100 | #169 | Good 2.3% |
| Ugandans | 62.2 /100 | #170 | Good 2.3% |
| Swedes | 61.6 /100 | #171 | Good 2.3% |
| Czechoslovakians | 58.9 /100 | #172 | Average 2.3% |
| Celtics | 55.4 /100 | #173 | Average 2.3% |
| Afghans | 50.0 /100 | #174 | Average 2.3% |
| Immigrants | Jamaica | 49.1 /100 | #175 | Average 2.3% |
| Danes | 48.2 /100 | #176 | Average 2.3% |
| Colombians | 48.0 /100 | #177 | Average 2.3% |
| Costa Ricans | 44.1 /100 | #178 | Average 2.3% |
| Welsh | 44.0 /100 | #179 | Average 2.3% |
| Yugoslavians | 43.9 /100 | #180 | Average 2.3% |
| Jamaicans | 43.5 /100 | #181 | Average 2.3% |
Demographics Similar to Immigrants from Taiwan by Single Father Households
In terms of single father households, the demographic groups most similar to Immigrants from Taiwan are Cypriot (1.8%, a difference of 0.16%), Immigrants from Ireland (1.8%, a difference of 0.27%), Immigrants from Hong Kong (1.8%, a difference of 0.37%), Immigrants from China (1.8%, a difference of 0.40%), and Okinawan (1.9%, a difference of 0.76%).
| Demographics | Rating | Rank | Single Father Households |
| Soviet Union | 100.0 /100 | #1 | Exceptional 1.8% |
| Immigrants | Israel | 100.0 /100 | #2 | Exceptional 1.8% |
| Filipinos | 100.0 /100 | #3 | Exceptional 1.8% |
| Immigrants | Uzbekistan | 100.0 /100 | #4 | Exceptional 1.8% |
| Immigrants | Hong Kong | 100.0 /100 | #5 | Exceptional 1.8% |
| Immigrants | Taiwan | 100.0 /100 | #6 | Exceptional 1.8% |
| Cypriots | 100.0 /100 | #7 | Exceptional 1.8% |
| Immigrants | Ireland | 100.0 /100 | #8 | Exceptional 1.8% |
| Immigrants | China | 100.0 /100 | #9 | Exceptional 1.8% |
| Okinawans | 100.0 /100 | #10 | Exceptional 1.9% |
| Immigrants | Belarus | 100.0 /100 | #11 | Exceptional 1.9% |
| Immigrants | Greece | 100.0 /100 | #12 | Exceptional 1.9% |
| Immigrants | Singapore | 100.0 /100 | #13 | Exceptional 1.9% |
| Immigrants | Lithuania | 100.0 /100 | #14 | Exceptional 1.9% |
| Immigrants | Eastern Asia | 100.0 /100 | #15 | Exceptional 1.9% |