Afghan vs Inupiat Unemployment Among Seniors over 75 years
COMPARE
Afghan
Inupiat
Unemployment Among Seniors over 75 years
Unemployment Among Seniors over 75 years Comparison
Afghans
Inupiat
9.0%
UNEMPLOYMENT AMONG SENIORS OVER 75 YEARS
8.3/ 100
METRIC RATING
219th/ 347
METRIC RANK
9.1%
UNEMPLOYMENT AMONG SENIORS OVER 75 YEARS
3.6/ 100
METRIC RATING
238th/ 347
METRIC RANK
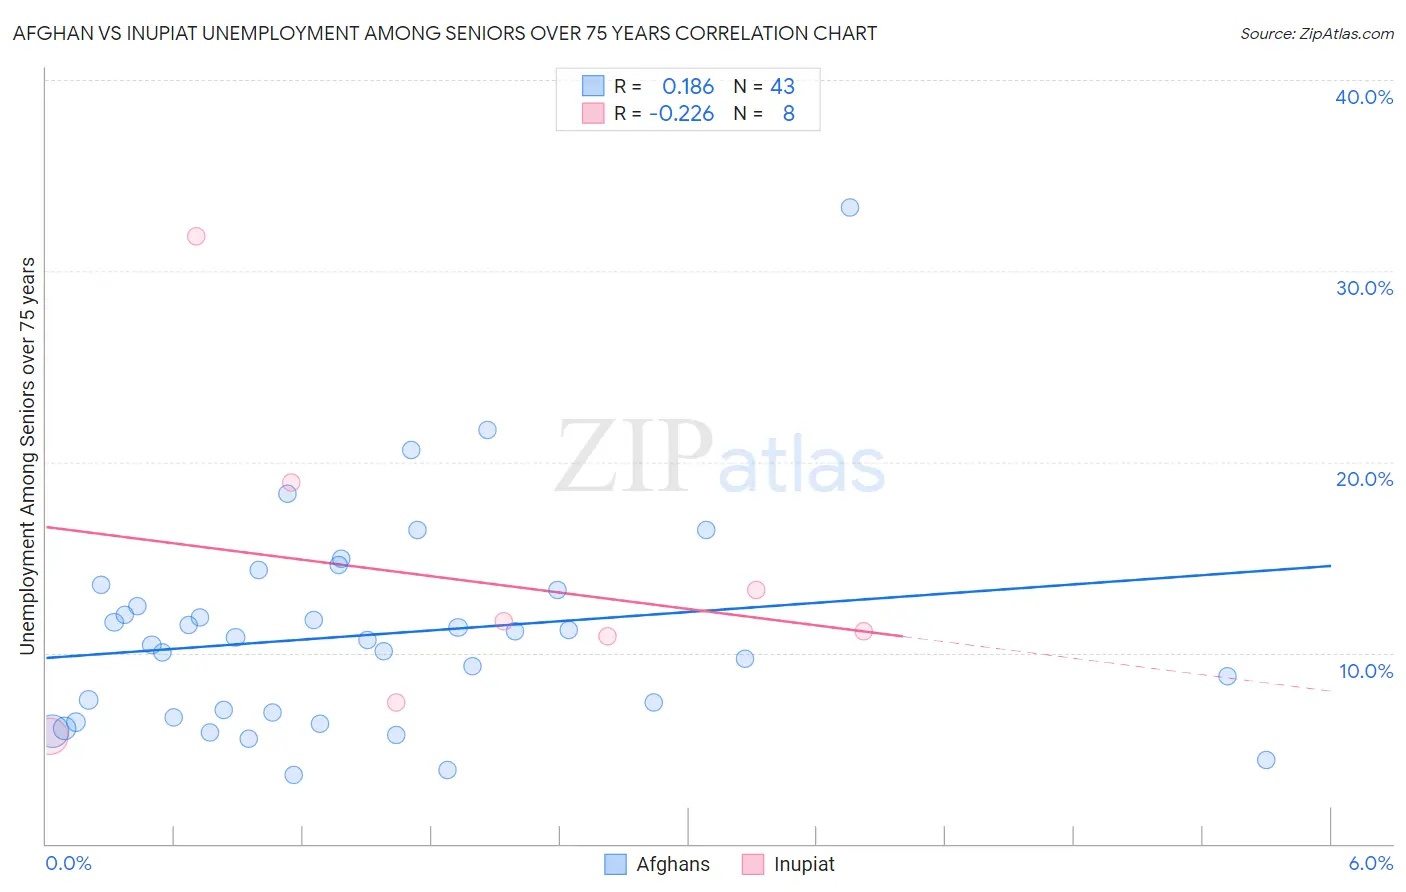
Afghan vs Inupiat Unemployment Among Seniors over 75 years Correlation Chart
The statistical analysis conducted on geographies consisting of 106,248,829 people shows a poor positive correlation between the proportion of Afghans and unemployment rate among seniors over the age of 75 in the United States with a correlation coefficient (R) of 0.186 and weighted average of 9.0%. Similarly, the statistical analysis conducted on geographies consisting of 73,726,920 people shows a weak negative correlation between the proportion of Inupiat and unemployment rate among seniors over the age of 75 in the United States with a correlation coefficient (R) of -0.226 and weighted average of 9.1%, a difference of 1.1%.
Unemployment Among Seniors over 75 years Correlation Summary
| Measurement | Afghan | Inupiat |
| Minimum | 3.6% | 5.7% |
| Maximum | 33.3% | 31.8% |
| Range | 29.7% | 26.2% |
| Mean | 10.9% | 13.8% |
| Median | 10.7% | 11.4% |
| Interquartile 25% (IQ1) | 6.6% | 9.1% |
| Interquartile 75% (IQ3) | 13.3% | 16.1% |
| Interquartile Range (IQR) | 6.7% | 7.0% |
| Standard Deviation (Sample) | 5.5% | 8.3% |
| Standard Deviation (Population) | 5.5% | 7.7% |
Demographics Similar to Afghans and Inupiat by Unemployment Among Seniors over 75 years
In terms of unemployment among seniors over 75 years, the demographic groups most similar to Afghans are Immigrants from Zimbabwe (9.0%, a difference of 0.080%), Guamanian/Chamorro (9.0%, a difference of 0.10%), Peruvian (9.0%, a difference of 0.18%), Immigrants from Africa (9.0%, a difference of 0.23%), and Immigrants from Jordan (9.0%, a difference of 0.24%). Similarly, the demographic groups most similar to Inupiat are Houma (9.1%, a difference of 0.10%), Jordanian (9.1%, a difference of 0.13%), Panamanian (9.1%, a difference of 0.14%), Vietnamese (9.1%, a difference of 0.33%), and Yugoslavian (9.1%, a difference of 0.38%).
| Demographics | Rating | Rank | Unemployment Among Seniors over 75 years |
| Immigrants | Africa | 9.7 /100 | #218 | Tragic 9.0% |
| Afghans | 8.3 /100 | #219 | Tragic 9.0% |
| Immigrants | Zimbabwe | 7.8 /100 | #220 | Tragic 9.0% |
| Guamanians/Chamorros | 7.7 /100 | #221 | Tragic 9.0% |
| Peruvians | 7.3 /100 | #222 | Tragic 9.0% |
| Immigrants | Jordan | 6.9 /100 | #223 | Tragic 9.0% |
| Costa Ricans | 6.3 /100 | #224 | Tragic 9.1% |
| Navajo | 6.1 /100 | #225 | Tragic 9.1% |
| Immigrants | Bangladesh | 5.9 /100 | #226 | Tragic 9.1% |
| Samoans | 5.7 /100 | #227 | Tragic 9.1% |
| Kenyans | 5.4 /100 | #228 | Tragic 9.1% |
| Hispanics or Latinos | 5.0 /100 | #229 | Tragic 9.1% |
| Northern Europeans | 4.9 /100 | #230 | Tragic 9.1% |
| Immigrants | Central America | 4.9 /100 | #231 | Tragic 9.1% |
| Africans | 4.9 /100 | #232 | Tragic 9.1% |
| Yugoslavians | 4.8 /100 | #233 | Tragic 9.1% |
| Vietnamese | 4.6 /100 | #234 | Tragic 9.1% |
| Panamanians | 4.0 /100 | #235 | Tragic 9.1% |
| Jordanians | 4.0 /100 | #236 | Tragic 9.1% |
| Houma | 3.9 /100 | #237 | Tragic 9.1% |
| Inupiat | 3.6 /100 | #238 | Tragic 9.1% |