Zimbabwean vs Yakama High School Diploma
COMPARE
Zimbabwean
Yakama
High School Diploma
High School Diploma Comparison
Zimbabweans
Yakama
91.1%
HIGH SCHOOL DIPLOMA
99.7/ 100
METRIC RATING
57th/ 347
METRIC RANK
80.0%
HIGH SCHOOL DIPLOMA
0.0/ 100
METRIC RATING
345th/ 347
METRIC RANK
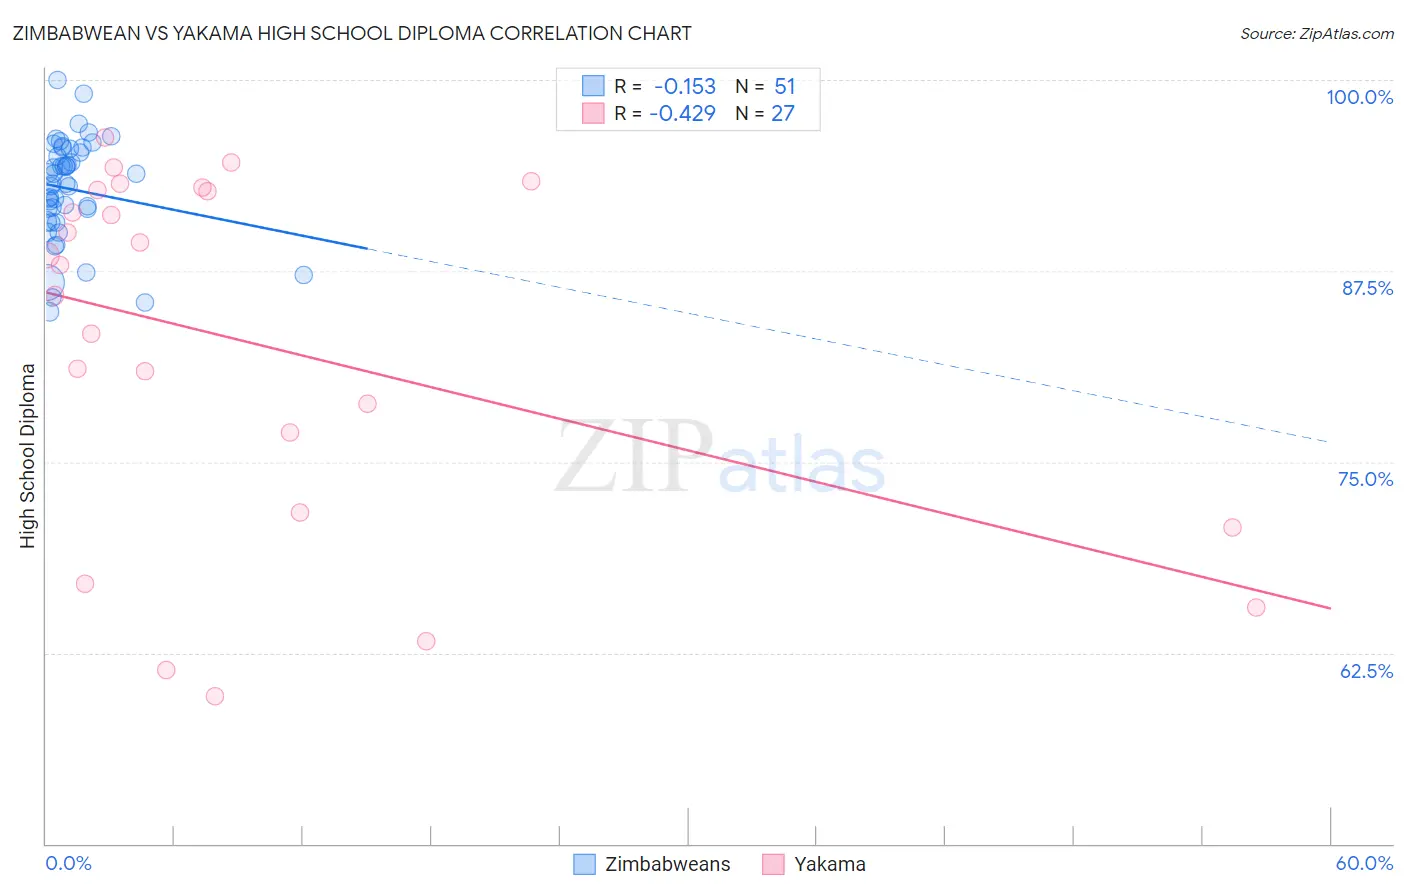
Zimbabwean vs Yakama High School Diploma Correlation Chart
The statistical analysis conducted on geographies consisting of 69,203,423 people shows a poor negative correlation between the proportion of Zimbabweans and percentage of population with at least high school diploma education in the United States with a correlation coefficient (R) of -0.153 and weighted average of 91.1%. Similarly, the statistical analysis conducted on geographies consisting of 19,923,144 people shows a moderate negative correlation between the proportion of Yakama and percentage of population with at least high school diploma education in the United States with a correlation coefficient (R) of -0.429 and weighted average of 80.0%, a difference of 13.8%.
High School Diploma Correlation Summary
| Measurement | Zimbabwean | Yakama |
| Minimum | 84.8% | 59.7% |
| Maximum | 100.0% | 96.3% |
| Range | 15.2% | 36.6% |
| Mean | 92.9% | 82.8% |
| Median | 93.2% | 87.9% |
| Interquartile 25% (IQ1) | 90.8% | 71.7% |
| Interquartile 75% (IQ3) | 95.5% | 92.8% |
| Interquartile Range (IQR) | 4.8% | 21.1% |
| Standard Deviation (Sample) | 3.4% | 11.7% |
| Standard Deviation (Population) | 3.3% | 11.4% |
Similar Demographics by High School Diploma
Demographics Similar to Zimbabweans by High School Diploma
In terms of high school diploma, the demographic groups most similar to Zimbabweans are Slavic (91.0%, a difference of 0.010%), Immigrants from North America (91.0%, a difference of 0.010%), Immigrants from Canada (91.1%, a difference of 0.020%), Immigrants from Japan (91.0%, a difference of 0.040%), and Serbian (91.1%, a difference of 0.050%).
| Demographics | Rating | Rank | High School Diploma |
| Welsh | 99.8 /100 | #50 | Exceptional 91.2% |
| New Zealanders | 99.7 /100 | #51 | Exceptional 91.1% |
| Immigrants | Sweden | 99.7 /100 | #52 | Exceptional 91.1% |
| Immigrants | Belgium | 99.7 /100 | #53 | Exceptional 91.1% |
| Macedonians | 99.7 /100 | #54 | Exceptional 91.1% |
| Serbians | 99.7 /100 | #55 | Exceptional 91.1% |
| Immigrants | Canada | 99.7 /100 | #56 | Exceptional 91.1% |
| Zimbabweans | 99.7 /100 | #57 | Exceptional 91.1% |
| Slavs | 99.7 /100 | #58 | Exceptional 91.0% |
| Immigrants | North America | 99.7 /100 | #59 | Exceptional 91.0% |
| Immigrants | Japan | 99.6 /100 | #60 | Exceptional 91.0% |
| Immigrants | Taiwan | 99.6 /100 | #61 | Exceptional 91.0% |
| Austrians | 99.6 /100 | #62 | Exceptional 91.0% |
| Immigrants | Netherlands | 99.6 /100 | #63 | Exceptional 91.0% |
| Ukrainians | 99.6 /100 | #64 | Exceptional 91.0% |
Demographics Similar to Yakama by High School Diploma
In terms of high school diploma, the demographic groups most similar to Yakama are Immigrants from Central America (80.1%, a difference of 0.16%), Spanish American Indian (79.8%, a difference of 0.29%), Immigrants from Mexico (79.5%, a difference of 0.56%), Immigrants from El Salvador (80.8%, a difference of 1.0%), and Immigrants from Guatemala (81.4%, a difference of 1.7%).
| Demographics | Rating | Rank | High School Diploma |
| Immigrants | Latin America | 0.0 /100 | #333 | Tragic 82.1% |
| Tohono O'odham | 0.0 /100 | #334 | Tragic 82.1% |
| Guatemalans | 0.0 /100 | #335 | Tragic 82.0% |
| Immigrants | Dominican Republic | 0.0 /100 | #336 | Tragic 82.0% |
| Immigrants | Yemen | 0.0 /100 | #337 | Tragic 81.8% |
| Salvadorans | 0.0 /100 | #338 | Tragic 81.7% |
| Pima | 0.0 /100 | #339 | Tragic 81.6% |
| Houma | 0.0 /100 | #340 | Tragic 81.5% |
| Mexicans | 0.0 /100 | #341 | Tragic 81.4% |
| Immigrants | Guatemala | 0.0 /100 | #342 | Tragic 81.4% |
| Immigrants | El Salvador | 0.0 /100 | #343 | Tragic 80.8% |
| Immigrants | Central America | 0.0 /100 | #344 | Tragic 80.1% |
| Yakama | 0.0 /100 | #345 | Tragic 80.0% |
| Spanish American Indians | 0.0 /100 | #346 | Tragic 79.8% |
| Immigrants | Mexico | 0.0 /100 | #347 | Tragic 79.5% |