Scandinavian vs Yakama High School Diploma
COMPARE
Scandinavian
Yakama
High School Diploma
High School Diploma Comparison
Scandinavians
Yakama
91.5%
HIGH SCHOOL DIPLOMA
99.9/ 100
METRIC RATING
23rd/ 347
METRIC RANK
80.0%
HIGH SCHOOL DIPLOMA
0.0/ 100
METRIC RATING
345th/ 347
METRIC RANK
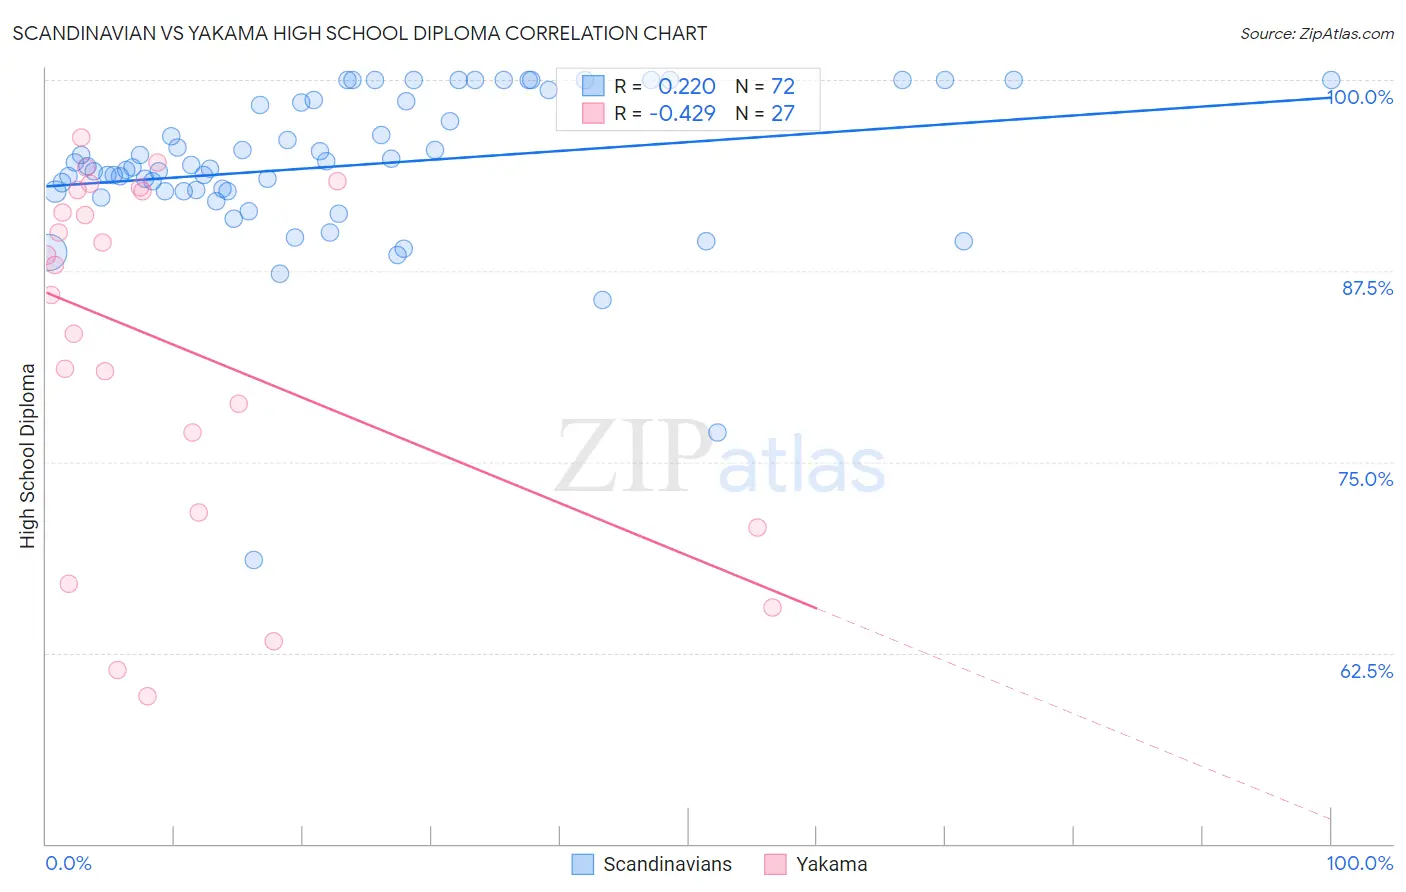
Scandinavian vs Yakama High School Diploma Correlation Chart
The statistical analysis conducted on geographies consisting of 472,659,475 people shows a weak positive correlation between the proportion of Scandinavians and percentage of population with at least high school diploma education in the United States with a correlation coefficient (R) of 0.220 and weighted average of 91.5%. Similarly, the statistical analysis conducted on geographies consisting of 19,923,144 people shows a moderate negative correlation between the proportion of Yakama and percentage of population with at least high school diploma education in the United States with a correlation coefficient (R) of -0.429 and weighted average of 80.0%, a difference of 14.4%.
High School Diploma Correlation Summary
| Measurement | Scandinavian | Yakama |
| Minimum | 68.6% | 59.7% |
| Maximum | 100.0% | 96.3% |
| Range | 31.4% | 36.6% |
| Mean | 94.4% | 82.8% |
| Median | 94.3% | 87.9% |
| Interquartile 25% (IQ1) | 92.7% | 71.7% |
| Interquartile 75% (IQ3) | 98.6% | 92.8% |
| Interquartile Range (IQR) | 5.9% | 21.1% |
| Standard Deviation (Sample) | 5.3% | 11.7% |
| Standard Deviation (Population) | 5.2% | 11.4% |
Similar Demographics by High School Diploma
Demographics Similar to Scandinavians by High School Diploma
In terms of high school diploma, the demographic groups most similar to Scandinavians are Italian (91.5%, a difference of 0.0%), Thai (91.5%, a difference of 0.0%), Estonian (91.6%, a difference of 0.030%), Filipino (91.6%, a difference of 0.040%), and Czech (91.6%, a difference of 0.050%).
| Demographics | Rating | Rank | High School Diploma |
| Finns | 100.0 /100 | #16 | Exceptional 91.7% |
| Immigrants | Singapore | 99.9 /100 | #17 | Exceptional 91.7% |
| Germans | 99.9 /100 | #18 | Exceptional 91.7% |
| Maltese | 99.9 /100 | #19 | Exceptional 91.6% |
| Czechs | 99.9 /100 | #20 | Exceptional 91.6% |
| Filipinos | 99.9 /100 | #21 | Exceptional 91.6% |
| Estonians | 99.9 /100 | #22 | Exceptional 91.6% |
| Scandinavians | 99.9 /100 | #23 | Exceptional 91.5% |
| Italians | 99.9 /100 | #24 | Exceptional 91.5% |
| Thais | 99.9 /100 | #25 | Exceptional 91.5% |
| Russians | 99.9 /100 | #26 | Exceptional 91.5% |
| Cypriots | 99.9 /100 | #27 | Exceptional 91.5% |
| Tlingit-Haida | 99.9 /100 | #28 | Exceptional 91.4% |
| Europeans | 99.9 /100 | #29 | Exceptional 91.4% |
| Iranians | 99.9 /100 | #30 | Exceptional 91.4% |
Demographics Similar to Yakama by High School Diploma
In terms of high school diploma, the demographic groups most similar to Yakama are Immigrants from Central America (80.1%, a difference of 0.16%), Spanish American Indian (79.8%, a difference of 0.29%), Immigrants from Mexico (79.5%, a difference of 0.56%), Immigrants from El Salvador (80.8%, a difference of 1.0%), and Immigrants from Guatemala (81.4%, a difference of 1.7%).
| Demographics | Rating | Rank | High School Diploma |
| Immigrants | Latin America | 0.0 /100 | #333 | Tragic 82.1% |
| Tohono O'odham | 0.0 /100 | #334 | Tragic 82.1% |
| Guatemalans | 0.0 /100 | #335 | Tragic 82.0% |
| Immigrants | Dominican Republic | 0.0 /100 | #336 | Tragic 82.0% |
| Immigrants | Yemen | 0.0 /100 | #337 | Tragic 81.8% |
| Salvadorans | 0.0 /100 | #338 | Tragic 81.7% |
| Pima | 0.0 /100 | #339 | Tragic 81.6% |
| Houma | 0.0 /100 | #340 | Tragic 81.5% |
| Mexicans | 0.0 /100 | #341 | Tragic 81.4% |
| Immigrants | Guatemala | 0.0 /100 | #342 | Tragic 81.4% |
| Immigrants | El Salvador | 0.0 /100 | #343 | Tragic 80.8% |
| Immigrants | Central America | 0.0 /100 | #344 | Tragic 80.1% |
| Yakama | 0.0 /100 | #345 | Tragic 80.0% |
| Spanish American Indians | 0.0 /100 | #346 | Tragic 79.8% |
| Immigrants | Mexico | 0.0 /100 | #347 | Tragic 79.5% |