Immigrants from Panama vs Yakama High School Diploma
COMPARE
Immigrants from Panama
Yakama
High School Diploma
High School Diploma Comparison
Immigrants from Panama
Yakama
88.0%
HIGH SCHOOL DIPLOMA
3.1/ 100
METRIC RATING
233rd/ 347
METRIC RANK
80.0%
HIGH SCHOOL DIPLOMA
0.0/ 100
METRIC RATING
345th/ 347
METRIC RANK
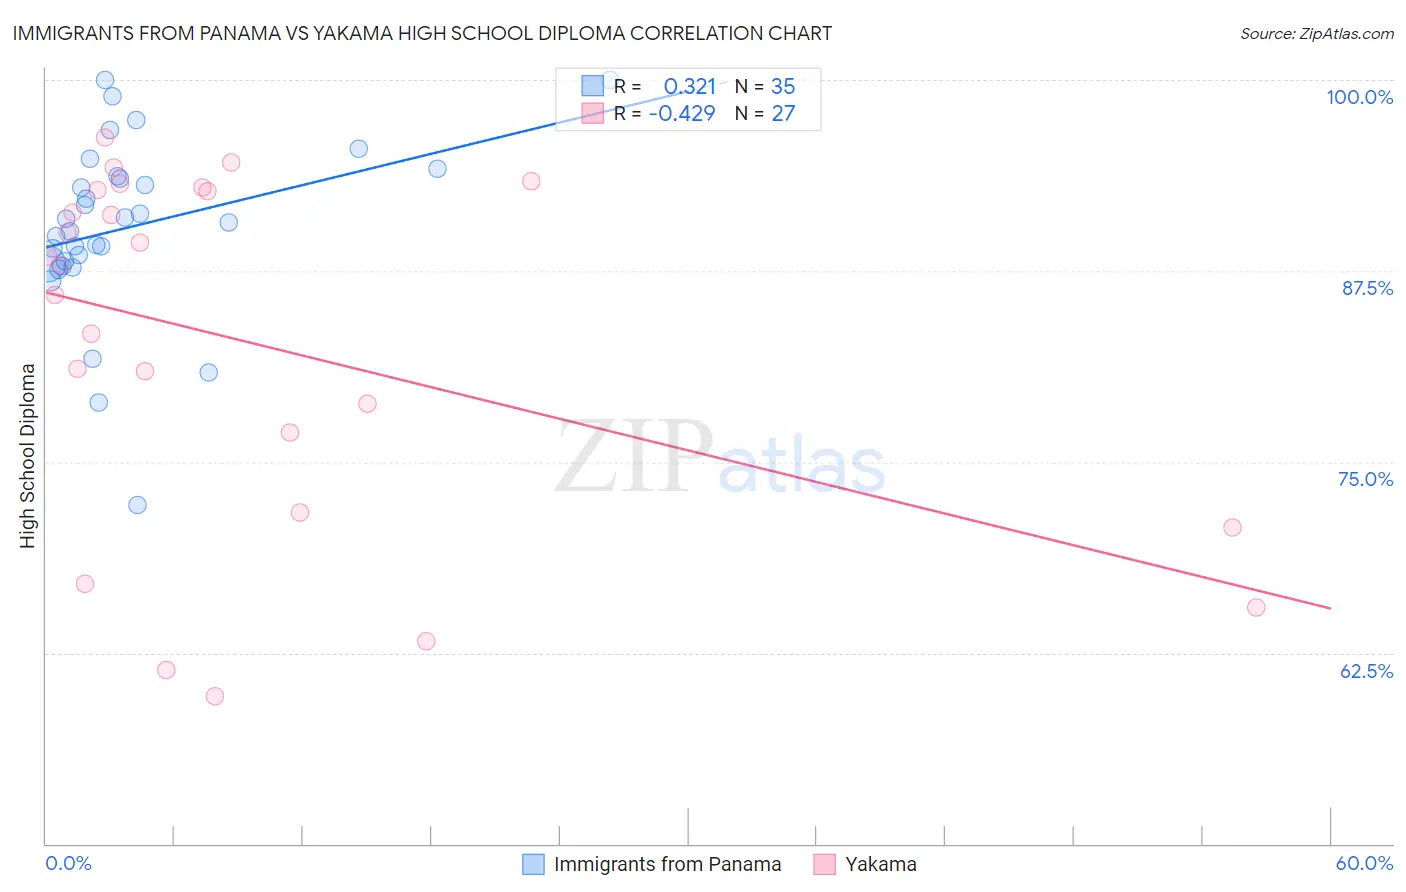
Immigrants from Panama vs Yakama High School Diploma Correlation Chart
The statistical analysis conducted on geographies consisting of 221,182,871 people shows a mild positive correlation between the proportion of Immigrants from Panama and percentage of population with at least high school diploma education in the United States with a correlation coefficient (R) of 0.321 and weighted average of 88.0%. Similarly, the statistical analysis conducted on geographies consisting of 19,923,144 people shows a moderate negative correlation between the proportion of Yakama and percentage of population with at least high school diploma education in the United States with a correlation coefficient (R) of -0.429 and weighted average of 80.0%, a difference of 10.0%.
High School Diploma Correlation Summary
| Measurement | Immigrants from Panama | Yakama |
| Minimum | 72.1% | 59.7% |
| Maximum | 100.0% | 96.3% |
| Range | 27.9% | 36.6% |
| Mean | 90.4% | 82.8% |
| Median | 90.7% | 87.9% |
| Interquartile 25% (IQ1) | 88.0% | 71.7% |
| Interquartile 75% (IQ3) | 93.7% | 92.8% |
| Interquartile Range (IQR) | 5.7% | 21.1% |
| Standard Deviation (Sample) | 5.8% | 11.7% |
| Standard Deviation (Population) | 5.7% | 11.4% |
Similar Demographics by High School Diploma
Demographics Similar to Immigrants from Panama by High School Diploma
In terms of high school diploma, the demographic groups most similar to Immigrants from Panama are Immigrants from Thailand (88.0%, a difference of 0.010%), Immigrants from Bahamas (88.0%, a difference of 0.020%), Immigrants from Middle Africa (88.0%, a difference of 0.040%), Subsaharan African (87.9%, a difference of 0.040%), and Taiwanese (87.9%, a difference of 0.050%).
| Demographics | Rating | Rank | High School Diploma |
| Uruguayans | 5.6 /100 | #226 | Tragic 88.2% |
| Immigrants | Liberia | 5.5 /100 | #227 | Tragic 88.2% |
| Kiowa | 5.3 /100 | #228 | Tragic 88.2% |
| Nigerians | 5.2 /100 | #229 | Tragic 88.2% |
| Blackfeet | 4.2 /100 | #230 | Tragic 88.1% |
| Colombians | 3.8 /100 | #231 | Tragic 88.1% |
| Immigrants | Middle Africa | 3.4 /100 | #232 | Tragic 88.0% |
| Immigrants | Panama | 3.1 /100 | #233 | Tragic 88.0% |
| Immigrants | Thailand | 3.1 /100 | #234 | Tragic 88.0% |
| Immigrants | Bahamas | 2.9 /100 | #235 | Tragic 88.0% |
| Sub-Saharan Africans | 2.8 /100 | #236 | Tragic 87.9% |
| Taiwanese | 2.8 /100 | #237 | Tragic 87.9% |
| Sioux | 2.7 /100 | #238 | Tragic 87.9% |
| South Americans | 2.7 /100 | #239 | Tragic 87.9% |
| Comanche | 2.2 /100 | #240 | Tragic 87.9% |
Demographics Similar to Yakama by High School Diploma
In terms of high school diploma, the demographic groups most similar to Yakama are Immigrants from Central America (80.1%, a difference of 0.16%), Spanish American Indian (79.8%, a difference of 0.29%), Immigrants from Mexico (79.5%, a difference of 0.56%), Immigrants from El Salvador (80.8%, a difference of 1.0%), and Immigrants from Guatemala (81.4%, a difference of 1.7%).
| Demographics | Rating | Rank | High School Diploma |
| Immigrants | Latin America | 0.0 /100 | #333 | Tragic 82.1% |
| Tohono O'odham | 0.0 /100 | #334 | Tragic 82.1% |
| Guatemalans | 0.0 /100 | #335 | Tragic 82.0% |
| Immigrants | Dominican Republic | 0.0 /100 | #336 | Tragic 82.0% |
| Immigrants | Yemen | 0.0 /100 | #337 | Tragic 81.8% |
| Salvadorans | 0.0 /100 | #338 | Tragic 81.7% |
| Pima | 0.0 /100 | #339 | Tragic 81.6% |
| Houma | 0.0 /100 | #340 | Tragic 81.5% |
| Mexicans | 0.0 /100 | #341 | Tragic 81.4% |
| Immigrants | Guatemala | 0.0 /100 | #342 | Tragic 81.4% |
| Immigrants | El Salvador | 0.0 /100 | #343 | Tragic 80.8% |
| Immigrants | Central America | 0.0 /100 | #344 | Tragic 80.1% |
| Yakama | 0.0 /100 | #345 | Tragic 80.0% |
| Spanish American Indians | 0.0 /100 | #346 | Tragic 79.8% |
| Immigrants | Mexico | 0.0 /100 | #347 | Tragic 79.5% |